
In this post, we are going to use a brand-new (at the time of writing) and still
somewhat experimental profiling method in GHC to show how to identify a memory
leak and the code causing it. This new profiling method, implemented by
Matthew, allows us to map heap closures to source locations. A key feature of
this new profiling mode is that it does not require a profiled build (i.e.
building with -prof). That’s desirable because non-profiled builds use less
memory and tend to be faster, primarily by avoiding bookkeeping that
prevents optimization opportunities.
A big thank you to Hasura for partnering with us and making the work presented here possible.
Let’s jump right in and try to analyze a memory leak. While you don’t need to read it to follow this blog post, we’ll be using this code: LargeThunk.hs. The rest of the blog post will show how to identify the problems in that code without having to read it in advance.
Status Quo
Let’s build/run LargeThunk.hs using a standard, -hT, memory profile that’s already available in
GHC. We’ll render it with eventlog2html.
Note that this is NOT a profiled (-prof) build of the LargeThunk executable:
$ ghc -eventlog -rtsopts -O2 LargeThunk
$ ./LargeThunk 100000 100000 30000000 +RTS -l -hT -i0.5 -RTS
$ eventlog2html LargeThunk.eventlog
The -eventlog -rtsopts options allow us to use the -l run time system option, which
generates the LargeThunk.eventlog file. -O2 turns on optimizations. The
-i0.5 RTS option forces a heap profile every 0.5 seconds and -hT indicates
that the heap profile should be broken down by closure type. The 100000 100000 30000000 are arguments to the LargeThunk program that result in a few gigabytes
of memory usage. Finally, eventlog2html renders the eventlog into a convenient html file:
LargeThunk.eventlog.html.

You can see that there is a large build-up of THUNKs (unevaluated closures)
starting from 11 seconds till about 54 seconds. This is despite using various
!s and NFData/force in an attempt to avoid such THUNKs. We’ve identified a
possible memory leak, but we don’t know what code is causing it. In larger
applications, identifying the offending code is difficult and a profile like
this would leave us scratching our heads.
Our new profiling method
Our new profiling method is a combination of 3 new flags: the -hi runtime
system flag and the -finfo-table-map and -fdistinct-constructor-tables
compile time flags.
These options are all related to info tables. The heap is made up of “closures”
which include evaluated Haskell values as well as unevaluated thunks. Each
closure on the heap contains a pointer to an info table which is some data about
the closure’s type and memory layout. Many closures may refer to the same info
table, for example thunks created at the same source location. Evaluated
closures of the same type and the same data constructor will also point to the
same info table, though we’ll see this will change with
-fdistinct-constructor-tables.
When the runtime system performs a memory profile, enabled by one of
various options,
the run time system occasionally scans all live closures on the heap.
The size of each closure is measured and closures are broken down (i.e. placed into groups) according to the
the profiling option used. For example, in the previous section, the
-hT option breaks down the profile by each closure’s “closure type”. The new -hi
option simply breaks down the heap profile by each closure’s
info table pointer. It will soon be apparent why that is useful.
When compiled with the -finfo-table-map option, GHC will build a mapping from
info table pointers to source locations and some extra type information. We call
each entry of this mapping an “info table provenance entry” or IPE for short.
This map will be baked into resulting binaries. This, of course, increases binary
size. Given a closure’s info table pointer (e.g. taken from the -hi heap
profile), we can use the mapping to get the source location at which the closure
was created. The extra type information means we don’t just know that thunks are
thunks, but we also know the type once that thunk is evaluated e.g. Double or
String. This source location and type information is invaluable for debugging
and the key advantage of using this new profiling method.
With -hi and -finfo-table-map we’ll get useful source locations for thunks
but not for evaluated closures. Hence the -fdistinct-constructor-tables
compile time option which creates distinct info tables per usage of data
constructors. This further increases binary size, but results in useful source
locations for evaluated closures which is crucial for debugging.
Trying it out
Now lets try these new build options with the LargeThunk.hs example:
$ ghc -eventlog -rtsopts -O2 -finfo-table-map -fdistinct-constructor-tables LargeThunk
$ ./LargeThunk 100000 100000 30000000 +RTS -l -hi -i0.5 -RTS
$ eventlog2html LargeThunk.eventlog
This generates: LargeThunk.eventlog.html.

Unsurprisingly, the graph looks similar to our -hT profile, but
our modified version of eventlog2html generated a “Detailed” tab in
LargeThunk.eventlog.html. This tab lets us see the profile as an
interactive table:
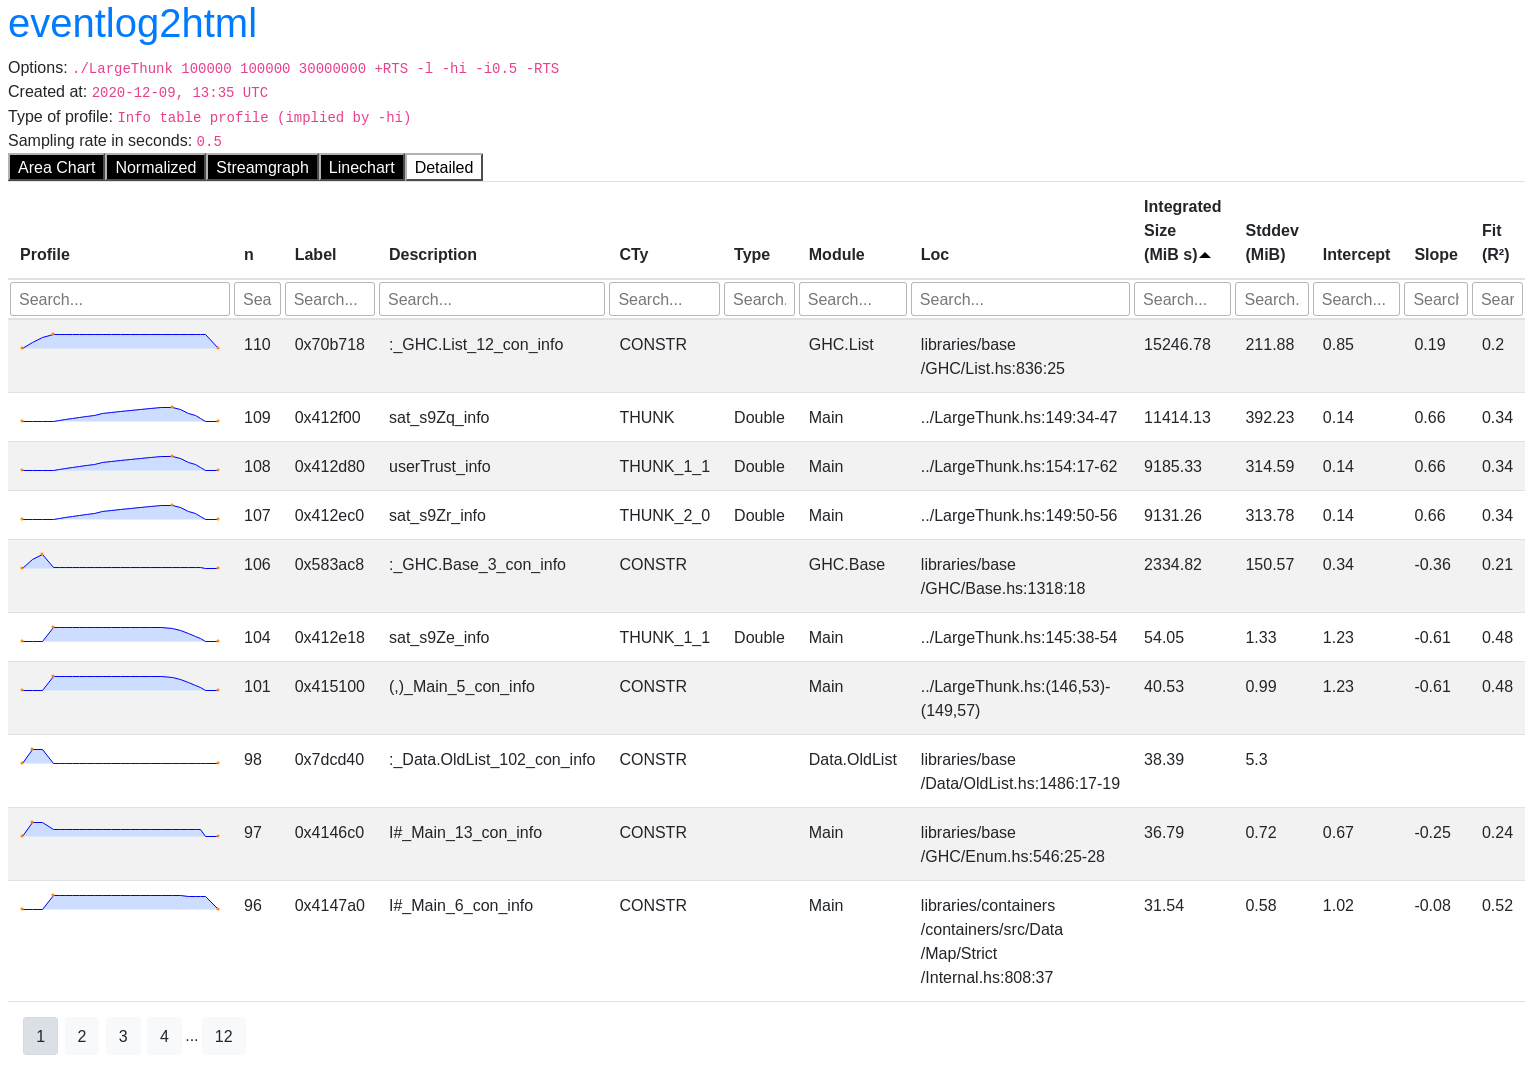
We hope to find interesting things near the top of this table as it is sorted by
integrated size i.e. the integral of residency with respect to time. The first row
corresponds to closures with info table address 0x70b718. From the
Description and CTy column we can tell that these closures are the : list
constructor. Specifically, those used in the GHC.List module at the source
location libraries/base/GHC/List.hs:836:25 as listed in the Module and Loc
columns. We can also see from the sparkline in the leftmost column that the
residency of these closures remains mostly constant throughout the profile. This
is not particularly suspect and with a little domain knowledge we know that the
program builds a large list on startup which could explain this row of the
profile.
The next 3 rows are far more interesting. The sparklines show the residency of
these 3 closures are closely correlated. The closure types indicate they
are THUNKs and the Type indicates that they will be Doubles once evaluated.
Combined, these make up about 3 GiB of memory. Let’s have a look at the
corresponding code in LargeThunk.hs. The Loc columns points to
weightedScore' and weight' on line 149 as well as the full definition of
userTrust on line 154:
{- 142 -}            go :: Map MovieID (Double, Double) -> Rating -> Map MovieID (Double, Double)
{- 143 -}            go weights (Rating userID movieID score) = M.alter
{- 144 -}                (\case
{- 145 -}                    Nothing -> Just (userTrust * score, userTrust)
{- 146 -}                    Just (weightedScore, weight) -> let
{- 147 -}                        weightedScore' = weightedScore + (userTrust * score)
{- 148 -}                        weight'        = weight        + userTrust
{- 149 -}                        in Just (weightedScore', weight')
{- 150 -}                )
{- 151 -}                movieID
{- 152 -}                weights
{- 153 -}                where
{- 154 -}                userTrust = trust ((users movieDB) M.! userID)
We can now see that the THUNK closures are coming from 3 lazy bindings:
weightedScore', weight', and userTrust. By looking at the usage of go we
can see that we’re folding over a large list of ratings:
foldl' go M.empty (ratings movieDB)Each call to go creates new THUNKs that kept alive any previous such
THUNKs. This leads to a long chain of THUNKS that causes the
memory leak. Note, even though foldl' is strict in the accumulator and the
accumulator is a strict map, the elements of the map are only evaluated to weak
head normal form. In this case, the elements are tuples and their contents are
lazy. By adding !s, we make the 3 bindings strict, avoid the build up of
THUNKs, and hence avoid the memory leak:
{- 142 -}            go :: Map MovieID (Double, Double) -> Rating -> Map MovieID (Double, Double)
{- 143 -}            go weights (Rating userID movieID score) = M.alter
{- 144 -}                (\case
{- 145 -}                    Nothing -> Just (userTrust * score, userTrust)
{- 146 -}                    Just (weightedScore, weight) -> let
{- 147 -}                        !weightedScore' = weightedScore + (userTrust * score)
{- 148 -}                        !weight'        = weight        + userTrust
{- 149 -}                        in Just (weightedScore', weight')
{- 150 -}                )
{- 151 -}                movieID
{- 152 -}                weights
{- 153 -}                where
{- 154 -}                !userTrust = trust ((users movieDB) M.! userID)
If we run the same profile as before we see that the memory leak has disappeared! We’ve saved about 3 GiB of heap residency and shaved a good 30 seconds off of the run time: LargeThunk.eventlog.html.

Conclusion
We used our new profiling method, -hi, to directly identify source locations
related to a memory leak due to laziness. We managed to do this without a
profiled build. This is a step in the direction toward debugging production
builds which are rarely built with profiling enabled.
A few of us have already been using the new profiling mode to help analyse memory problems:
We (Matthew and David) have used this method to identify a small memory leak in GHC. We both quickly and independently identified the same memory leak. This was based off of a profile used when compiling Cabal. See #18925 and !4429. While the magnitude of the leak was relatively small, this anecdote goes to show that the new profiling method allows developers to quickly pinpoint memory issues even in a large code base like GHC’s.
Matthew tried using the profiling mode to analyse a memory issue in pandoc and quickly found a problem where the XML parsing library retained all the input tokens due to excessive laziness.
Zubin Duggal debugged a memory leak in his XMonad config. The profiling mode allowed him to very quickly identify where in his source program the leak was happening. This one wasn’t caused by laziness but a list continually growing during the execution of the program.
At the time of writing, this work is not yet merged into GHC, but is under
review in MR !3469.
For those eager to try it out, we’d recommend building this backport to GHC 8.10.2. See these instructions
as you’ll likely want to build core libraries with -finfo-table-map -fdistinct-constructor-tables and use an eventlog2html build with
IPE support.
Please try it out, and let us know if you have any success using the profiling mode for your own applications.
Binary size
Increased binary size was mentioned, but how big an effect is it? Taking
cabal-install as an example, a clean build without IPE yields a 44.4 MiB
binary. Building with -finfo-table-map -fdistinct-constructor-tables for
cabal-install and all its dependencies including base yields a 318.8 MiB
binary. That’s a significant increase and a cost to consider when using this new
profiling method. This could be mitigated by building IPE only for select code
such as the Cabal library and cabal-install binary. This yields a 135
MiB binary, but of course will only have source location information for a
smaller subset of closures: only those with a source location in
Cabal/cabal-install.
Comparison to DWARF
GHC already supports DWARF debugging output. The primary difference between IPE
based profiling and DWARF based profiling is that IPE relates data (i.e.
closures) to source locations while DWARF relates machine code to source
locations. In practice, DWARF allows time profiling with tools such as prof
(see Ben’s post on DWARF support in GHC). That can
tell us what source code is responsible for the runtime of our program. IPE on
the other hand, allows memory profiling which can tell us what source code is
responsible for the allocation of data. An advantage that both IPE and DWARF
share is that they can be used with minimal time and memory performance
overheads. In both cases, this is at the cost of larger binary size.