
Well-Typed are happy to announce Eventlog Live, a program that streams real-time telemetry from any Haskell application to any observability platform that supports the OpenTelemetry protocol, such as Grafana Cloud, Prometheus, or local viewers such as otel-tui and otel-desktop-viewer.
In this blog post, we’ll show a variety of ways to use Eventlog Live. For each showcase, we’ll link to the relevant instructions using Eventlog Live version 0.10.0.0 as well as the script that was used to generate the showcase. If you would like to use Eventlog Live, we recommend following the up-to-date instructions in the README of the latest release of Eventlog Live.

Heap Profiles by Closure Type

The Grafana Heap Profiles dashboard, which shows a heap profile broken down by closure type (-hT) as well as a variety of metrics for memory usage. For detailed instructions, see Eventlog Live – The Basic Version. This showcase uses the oddball-with-pipe example with the Docker Compose setup in demo/docker-compose.yml.
Eventlog Live
Eventlog Live analyses your application’s eventlog and exports it via the OpenTelemetry protocol.
Eventlog Live is lightweight, runs side-by-side with your application in only a few megabytes of memory, and requires no instrumentation other than the -threaded and -rtsopts build options.1
All you need is somewhere to send your data.
For instance, if you have a Grafana Cloud2 account, adding telemetry to your application is as easy as:
# Create a pipe for the eventlog
EVENTLOG_PIPE="/tmp/eventlog.pipe"
mkfifo "${EVENTLOG_PIPE}"

# Start your application
your-application +RTS -l -ol"${EVENTLOG_PIPE}" -hT --eventlog-flush-interval=1 -RTS &

# Start eventlog-live-otlp
OTEL_SERVICE_NAME="your-application"                                              \
OTEL_RESOURCE_ATTRIBUTES="service.instance.id=$(uuidgen)"                         \
OTEL_EXPORTER_OTLP_ENDPOINT="https://otlp-gateway-<YOUR_REGION>.grafana.net/otlp" \
OTEL_EXPORTER_OTLP_HEADERS="Authorization=Basic%20<YOUR_AUTHORIZATION_HEADER>"    \
eventlog-live-otlp --eventlog-file="${EVENTLOG_PIPE}" -hT --eventlog-flush-interval=1
Out of the box, Eventlog Live supports -hT and -hi heap profiles3 as well as a variety of memory usage metrics, cost-centre stack profiles, log messages, productivity, detailed thread & capability usage traces. Each of these features is showcased below using an example Grafana dashboard. These dashboards can be found in the repository under demo-grafana-cloud/grafana-dashboards and demo/config/grafana-dashboards. Click any showcase for more information.

Heap Profiles by Info Table

The Grafana Heap Profiles dashboard, which shows a variety of metrics for memory usage and a heap profile broken down by info table (-hi). For detailed instructions, see Eventlog Live with Heap Profiling by Info Table. This showcase uses the oddball-with-hi example with the Docker Compose setup in demo/docker-compose.yml.

Cost-Centre Stack Profiles

The Grafana Cost-Centre Stack Profiles dashboard, which shows the cost-centre stack samples collected by GHC's built-in profiler in a flame graph.
For detailed instructions, see Eventlog Live with Cost-Centre Stack Profiling.
This showcase uses the jumpy-jump-with-cost-centre-profiler example with the Docker Compose setup in demo/docker-compose.yml.

Logs

The Grafana Logs dashboard, which shows log messages emitted using traceEventIO, traceMarkerIO, and threadLabel.
This showcase uses the oddball-with-pipe example with the Docker Compose setup in demo/docker-compose.yml.

Logs as Markers

The Grafana Heap Profiles dashboard, which shows dotted red lines on each visualisation at the times that correspond to the markers, emitted using traceMarkerIO, that match the regular expression Summing \d+ numbers.
This showcase uses the oddball-with-hi example with the Docker Compose setup in demo/docker-compose.yml.
Productivity


The Grafana Threads dashboard, which shows the cumulative productivity per capability, as well as the overall productivity over a sliding window.
This showcase uses the oddball-with-pipe example with the Docker Compose setup in demo/docker-compose.yml.
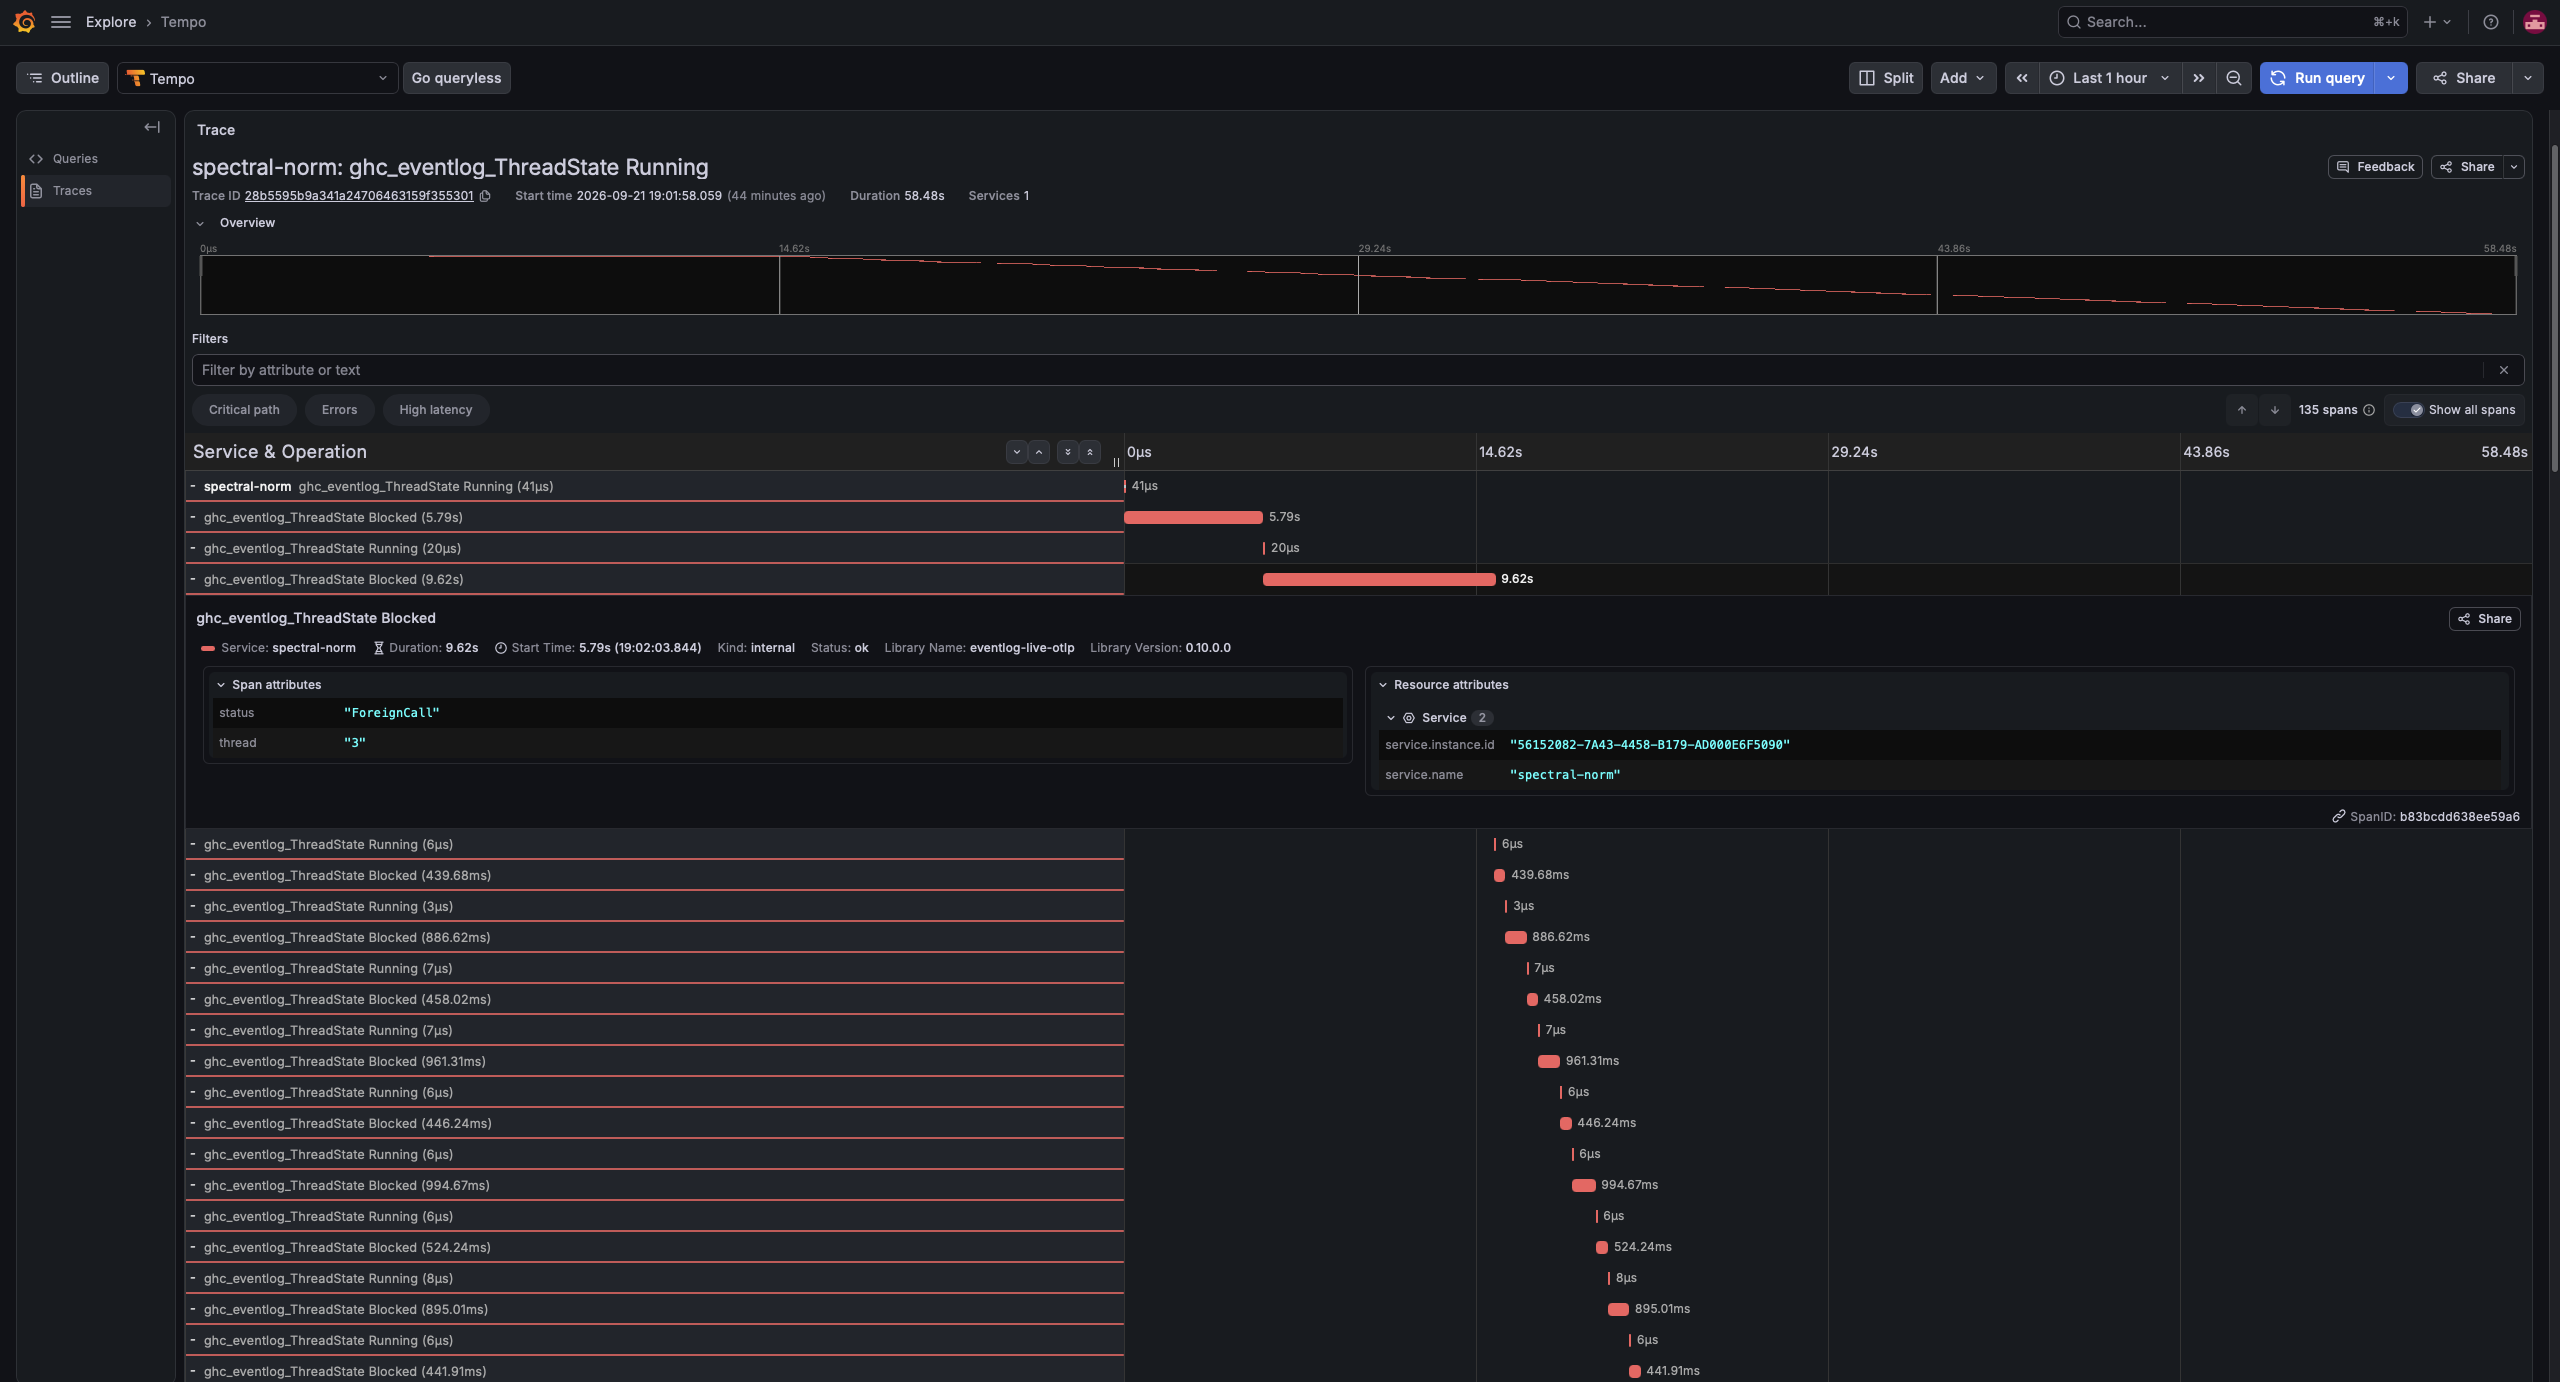
Thread & Capability Usage
Eventlog Live’s OTLP exporter is configured using OpenTelemetry’s environment variables. The output of eventlog-live-otlp --help has comprehensive documentation on its support for these environment variables.
By default, Eventlog Live aggregates telemetry data over 1 second intervals and exports every 30 seconds, but these intervals can be configured for each telemetry signal using configuration files.
Dynamic Control with Eventlog Socket
If you instrument your application with eventlog-socket, you’ll be able to start/stop profiling while your application is running using a REST API, which you can connect, e.g., to buttons on your Grafana dashboard, as we’ve done on the example Heap Profiles dashboard.
Dynamic Control with Eventlog Socket


Using the buttons on the Grafana Heap Profiles dashboard. When “Stop” is pressed, the heap profile flatlines. When “Start” is pressed, the heap profile resumes. The “Census” button can be used to request a single heap census. For detailed instructions, see Eventlog Live with Eventlog Socket. This showcase uses the oddball-with-hT example with the Docker Compose setup in demo/docker-compose.yml.
Eventlog Socket lets your application write its eventlog over sockets and uses the other direction of communication for control messages. Eventlog Socket’s control protocol is generic. It isn’t bound to any specific application or library. Any library can register its own control commands under its own namespace,4 using Haskell IO actions as callbacks:
registerMyEventlogSocketSupport = do
  myPackageNamespace <- registerNamespace "my-package-name"
  registerCommand myPackageNamespace (CommandId 1) myCommandCallback1
  registerCommand myPackageNamespace (CommandId 2) myCommandCallback2
Any command that your application registers with Eventlog Socket can be invoked using Eventlog Live’s REST API.
For security reasons, Eventlog Socket’s control protocol and Eventlog Live’s REST API are hidden behind the +control feature flag, which is disabled by default. If you develop a library that (optionally) uses Eventlog Socket’s control protocol, we recommend using the same +control feature flag.
Call-Stack Profiles with GHC Stack Profiler
If you instrument your application with ghc-stack-profiler, you’ll be able to use its lightweight call-stack profiler.
Call-Stack Profiles with GHC Stack Profiler

The Grafana Call-Stack Profiles dashboard, which shows the call-stack samples collected by ghc-stack-profiler in a flame graph. For detailed instructions, see Eventlog Live with GHC Stack Profiler. This showcase uses the jumpy-jump-with-ghc-stack-profiler example with the Docker Compose setup in demo/docker-compose.yml.

GHC Stack Profiler samples GHC’s runtime call-stack, rather than a virtual cost-centre stack, and writes these samples to the eventlog. Based on our benchmarks, GHC Stack Profiler has virtually no overhead when it’s not running and we observed 2-8% overhead while it was running, compared to GHC’s built-in cost-centre stack profiler, where we observed 54-128% overhead while it wasn’t running and 98-136% overhead while it was running.
If you’ve also instrumented your application with Eventlog Socket, you’ll be able to start/stop GHC Stack Profiler while your application is running using the same REST API, which you can connect, e.g., to buttons on your Grafana dashboard, as we’ve done on the example Call-Stack Profiles dashboard.
GHC Stack Profiler can also be used without Eventlog Live, e.g., by exporting the profiles to speedscope. We’ll discuss GHC Stack Profiler in detail in an upcoming blog post.
Local Viewers
Eventlog Live does not yet include a built-in telemetry viewer, as it was primarily developed to monitor long-running processes in production. We are currently developing a built-in telemetry viewer, but the prototype is not yet ready for publication. In the meantime, some developers may feel that using either Grafana Cloud or the Docker Compose setup in demo/docker-compose.yml is too heavyweight for local development. Fortunately, the OpenTelemetry ecosystem has several lightweight telemetry viewers, such as otel-tui and otel-desktop-viewer, which are general purpose telemetry viewers that use a text and browser-based UI, respectively.
Eventlog Live with otel-tui

![An animated GIF that shows a screen recording of a terminal session. The terminal is split into three screens. On the left, taking up the majority of the terminal, is a screen labelled 'otel-tui'. On the right, split vertically, are two screens labelled 'oddball' and 'eventlog-live-otlp'. The 'otel-tui' screen is itself split into three subscreens. A narrow column on the left, labelled 'Metrics', lists all incoming metrics by name. These names correspond to the names described under Heap Profile by Closure Type, except formatted in camel-case and prefixed with 'ghc_eventlog_'. Currently, the metric named 'ghc_eventlog_HeapLive' is selected. The wide column on the right is split vertically. The top row, labelled 'Details', shows the exact structure of the selected OTLP message for the selected metric. The bottom row, labelled 'Chart', shows a text rendering of a line chart that shows the values of the 'ghc_eventlog_HeapLive' metric. This shows a spiky line, which jumps between 10-30MB, though the Y-axis is labelled in bytes rather than megabytes. The 'oddball' screen shows the output of the oddball program, which consists of many lines saying 'Generating X random numbers' and 'Sum: Y' for ever-changing values of X and Y. The 'eventlog-live-otlp' screen shows the debug output of Eventlog Live, which consists of many lines saying '[DEBUG] Received X events.', '[DEBUG] Exported Y metrics.', and '[DEBUG] Exported Z logs.', for ever-changing values of X, Y, and Z.](../../../../blog/aux/images/real-time-telemetry-with-eventlog-live/oddball-with-otel-tui-2026-09-22.webp)
This showcase uses the oddball-with-otel-tui example with otel-tui version 0.7.4.
This example creates a screen session that combines otel-tui with oddball and eventlog-live-otlp.
Eventlog Live with otel-desktop-viewer


This showcase uses the oddball-with-otel-desktop-viewer example with otel-desktop-viewer version 0.5.0.
Future Work
We are currently developing a built-in telemetry viewer that is purpose-built for GHC’s telemetry, with the intention of making Eventlog Live more useful for short development sessions. We’re also planning to create a library for writing structured log messages to the eventlog, expand the analyses supported by Eventlog Live, and expand the Eventlog Socket protocol to permit command arguments. Moreover, we’re always open to suggestions and feature requests from the community.
Acknowledgements
This work has been performed in collaboration with Mercury, who have a long-term commitment to the scalability and robustness of the Haskell ecosystem. Well-Typed are always interested in projects and looking for funding to improve Haskell tools. Please contact info@well-typed.com if we might be able to work with you!
If your application is built with GHC 9.2 or older, it must also be built with
-eventlog. Since GHC 9.4, the eventlog is enabled by default.↩︎The repository contains a self-contained demo for using Eventlog Live with Grafana Cloud. Unfortunately, as Grafana Cloud changes its user interface frequently, that demo may not be fully up-to-date.↩︎
Eventlog Live is developed and tested with the
-hTand-hiheap profile breakdowns, but the-hm/-hd/-hy/-heheap profile breakdowns should work. The-hc/-hb/-hrheap profile breakdowns require additional support, which is planned but not yet implemented.↩︎We strongly recommend using your package name.↩︎