
ghc-events-analyze is a new simple Haskell profiling tool that uses GHC's eventlog system. It helps with some profiling use cases that are not covered by the existing GHC profiling modes or tools. It has two major features:
- While ThreadScope shows
CPU activity across all your cores,
ghc-events-analyzeshows CPU activity across all your Haskell threads.
- It lets you label periods of time during program execution (by instrumenting your code with special trace calls) and then lets you visualize those time periods or get statistics on them.
It is very useful for profiling code when ghc's normal profiling mode is not available, or when using profiling mode would perturb the code too much. It is also useful when you want time-profiling information with a breakdown over time rather than totals for the whole run.
We developed the tool at Well-Typed while working on client projects where we had profiling needs that were not covered by the existing tools. We are releasing the tool in the hope that it will be useful to others.
Motivating Example
Suppose we want to understand the runtime performance of the following simple multi-threaded application:
import Control.Concurrent (threadDelay)
import Control.Concurrent.Async (async, wait)

-- Intentionally slow fib
fib :: Integer -> Integer
fib 0 = 1
fib 1 = 1
fib n = fib (n - 1) + fib (n - 2)

printFib :: Integer -> IO ()
printFib n = print (fib n)

blips :: IO ()
blips = do
  putStrLn "BLIP"
  threadDelay 5000000
  putStrLn "BLIP"

main :: IO ()
main = do
  a1 <- async $ mapM_ printFib [30, 32 .. 38]
  a2 <- async $ mapM_ printFib [31, 33 .. 39]
  threadDelay 5000000
  a3 <- async $ blips
  mapM_ wait [a1, a2, a3]
We can compile this application and ask it to produce an eventlog:
ghc ex0 -eventlog
./ex0 +RTS -l
But when we open this eventlog in ThreadScope the result is not particularly enlightening:

The program was compiled without the -threaded flag, forcing all work to run
on a single HEC (Haskell Execution Context — roughly, a CPU core). This makes
it impossible to see the distribution of workload across the various
application threads. This will be true whenever multiple threads are executed
by a single HEC (i.e., almost always). Of course ThreadScope is really
designed for looking at parallel programs, and that's not what we've got here.
Here we're trying to understand the behaviour of a simple concurrent program.
If we run the same eventlog through ghc-events-analyze instead we get

Some points to note:
ghc-events-analyzeapplies quantization; the total execution time is divided up intonbuckets (by default 100; for these examples we chose 50) and computes for each bucket and each thread what percentage of that bucket the thread was active.- This percentage is used to colour each block in the diagram; darker means a
larger percentage. If the thread was not active at all the block is grey,
but a percentage
qother than 0 is shown as a darkness0.1 + 0.9 * q. This means that we can visually see when a thread does anything at all; for instance, it is immediately clear from the diagram when theblipsthread (with ID 4) is doing something. If we used the percentageqdirectly as darkness then a thread doing nothing would be visually indistinguishable from a thread doing just a print, say. - We can see that initially both threads are equally busy (the scheduler is
assigning approximately 48% CPU time to both), until the first thread
completes and the second thread gets 97% of CPU (
ghc-events-analyzealso generates the same report in textual form with precise values for each block). - The lifetime of each thread is also immediately clear.
Instrumentation
If we instrument our code, we can improve this diagram in a number of ways. We
can use labelThread from GHC.Conc to give our threads names, so that it
becomes easier to see what's what.
Moreover, ghc-events-analyze lets us give labels to periods of time during
execution which we can then visualise or get statistics on. To label a period
of time we use the event tracing functions from
Debug.Trace.
We mark the start of a period with
traceEventIO "START <eventName>"
and the end with
traceEventIO "STOP <eventName>"
Use traceEventIO
if you are in an IO context, while in a pure context you can use
traceEvent.
Note that these labelled time periods are completely independent of threads; they can overlap each other, span multiple threads, etc. Here's our example application again, but with some instrumentation added:
import Control.Concurrent (myThreadId, threadDelay)
import Control.Concurrent.Async (Async, async, wait)
import Control.Exception (bracket_)
import Debug.Trace (traceEventIO)
import GHC.Conc (labelThread)

event :: String -> IO a -> IO a
event label =
  bracket_ (traceEventIO $ "START " ++ label)
           (traceEventIO $ "STOP "  ++ label)

async' :: String -> IO a -> IO (Async a)
async' label act = async $ do
  tid <- myThreadId
  labelThread tid label
  act

-- Intentionally slow fib
fib :: Integer -> Integer
fib 0 = 1
fib 1 = 1
fib n = fib (n - 1) + fib (n - 2)

printFib :: Integer -> IO ()
printFib n = event ("fib" ++ show n) $ print (fib n)

blips :: IO ()
blips = do
  putStrLn "BLIP"
  threadDelay 5000000
  putStrLn "BLIP"

main :: IO ()
main = do
  a1 <- async' "evens" $ mapM_ printFib [30, 32 .. 38]
  a2 <- async' "odds"  $ mapM_ printFib [31, 33 .. 39]
  threadDelay 5000000
  a3 <- async' "blips"  $ blips
  mapM_ wait [a1, a2, a3]
Running ghc-events-analyze over the eventlog generated by this code yields

If we run the same code using the threaded runtime (but still on a single core), we get

and if we run it on two cores

We can see that the evens and odds threads are now in fact running in
parallel, and that the computation of fib 38 is finished well before the
computation of fib 39.
Totals
Bear in mind, however, that ghc-events-analyze divides the total time up
into n buckets, so what you can not see from these last two diagrams is
that the total time taken is less when running on two cores.
ghc-events-analyze also outputs some totals. For the single core case it
tells us
GC               1343672000ns    1.344s

USER EVENTS (user events are corrected for GC)
fib39           24480557000ns   24.481s
fib38           21493145000ns   21.493s
fib37           12702151000ns   12.702s
fib36            7823058000ns    7.823s
fib35            4797324000ns    4.797s
fib34            2966990000ns    2.967s
fib33            1800136000ns    1.800s
fib32            1097888000ns    1.098s
fib31             663900000ns    0.664s
fib30             419270000ns    0.419s
TOTAL           78244419000ns   78.244s

THREAD EVENTS
1                    138000ns    0.000s
IOManager (2)        296000ns    0.000s
3                    106000ns    0.000s
evens (4)       16826523000ns   16.827s
odds (5)        27488818000ns   27.489s
blips (6)             63000ns    0.000s
7                     27000ns    0.000s
TOTAL           44315971000ns   44.316s
and for the two cores case
GC               1171012000ns    1.171s

USER EVENTS (user events are corrected for GC)
fib39           18769541000ns   18.770s
fib38           12009913000ns   12.010s
fib37            7515686000ns    7.516s
fib36            4692912000ns    4.693s
fib35            2852639000ns    2.853s
fib34            1774758000ns    1.775s
fib33            1095500000ns    1.096s
fib32             674125000ns    0.674s
fib31             395699000ns    0.396s
fib30             240785000ns    0.241s
TOTAL           50021558000ns   50.022s

THREAD EVENTS
1                    138000ns    0.000s
IOManager (2)        269000ns    0.000s
3                     88000ns    0.000s
evens (4)       19338615000ns   19.339s
odds (5)        30086294000ns   30.086s
blips (6)             73000ns    0.000s
7                      9000ns    0.000s
TOTAL           49425486000ns   49.425s
For the user-labelled time periods the tool is giving us the wall-clock time between the "START" and "STOP" events, excluding time spent doing GC. If there are multiple start/stop periods for the same label then it gives us the total time. We exclude GC time because GC happens at essentially arbitrary points and it would not be helpful to account the full cost of a GC to one user-labelled time period (which might otherwise be very short indeed).
Some notes for this example:
- The total amount of time for our
fibNN-periods is more in the one core case than the two core case, because in the single core case neither of the threads evaluatingfibcalls are running all the time — since the two threads have to share the one core. - However, the total time across all threads is approximately the same in both cases; we are still doing the same amount of work, it's just that in the two core case the work of some of those threads is overlapped.
- It is important not to confuse user-labelled time periods with a thread
running and doing real work. We can see in this example in the single-core
case that the sum of all the
fibNNtime periods is much longer than the total execution time of all threads in the program (78.2 seconds vs 44.3 seconds). That is because we have two threads running these fib tasks but each of those threads is only getting about 50% of the CPU. In the two-core case the two threads each get a core to themselves and so the total of ourfibNNtime periods is very close to the total thread execution time (50.0 seconds vs 49.4 seconds).
Real World Application 1
Well-Typed have been developing a server application for a client. The client reported that after certain kinds of requests the server had unexpected spikes in CPU usage. For technical reasons we could not compile the server application in profiling mode, and hence profiling information was not available. Moreover, GHC's normal time profiling would have given us totals across the whole program run (broken down by cost centre), but we needed a breakdown of CPU usage over time. We could however generate an eventlog. Visualizing the eventlog with threadscope yielded

We can make certain educated guesses from this picture: the spikes in activity
are probably different requests coming in to the server, and the reported
unexpected CPU usage reported by the client might be related to garbage
collection (the orange blobs that threadscope shows). However, instrumenting
the code (by labelling some threads and labelling time periods that correspond
to the server handling different kinds of requests) and then running it through
ghc-events-analyze yielded a more informative picture:

(ghc-events-analyze's reports are fully customizable through a simple
scripting language; many of the diagrams in this blogpost are generated using
custom scripts in order to improve readability.)
The labelled time periods now clearly show when the server is
handing requests of type A and B, and we see corresponding spikes in CPU
activity in the server's main thread (with ID 6). Threads 4 and 5 handle
communication between the client and server, and we see "blips" at the start
and end of each request, as expected.
The garbage collection during the A requests is expected, both because of domain specific knowledge about what type A requests are, but also from the diagram: there are spikes in CPU usage of the server's Main thread. However, garbage collection during the B requests is not expected: again, both from domain specific knowledge about type B requests, but also from the diagram: there is barely any activity in the system at all, so why so much garbage collection?
This lead us to suspect "idle GC". The GHC garbage collector will run in
two cases: (1) when required when we're out of memory, and (2) after the whole
program has been idle for a bit. The latter is known as idle GC. The point of
idle GC is the hope that we might be able to return some memory to the OS. The
default is to do a GC 0.3 seconds after the program becomes idle. This means if
your program does a tiny bit of work every 0.4 seconds but is otherwise idle
then you're going to be paying for a major GC every 0.4 seconds. We can adjust
the timeout for when idle GC happens, or even disable it entirely using the
+RTS -Ix flag. In our case, running the server with a much longer timeout for
idle GC cycles yielded this picture:

Note how we no longer see much garbage collection during B requests; we still get garbage collection during A requests, but that is expected. Moreover, we don't see any garbage collection after the second B request either. We found that this had been due to a new thread (199) that was spawned by the second B request. This thread was running occasionally but because it was the only active thread it determined whether the whole system was idle. It was letting the system go idle just long enough to trigger idle GC, then doing a tiny bit of work, more idle GC etc. These collections are not cheap because they are major collections that scan the whole heap.
The simple thing to do in this situation is to just disable idle GC entirely
with +RTS -I0. We decided to keep it because it is still useful to return
memory to the system in this case, we just use a much longer timeout.
Real World Application 2
Well-Typed was asked by a client to help improve the performance of an application. At one point during this work we needed to determine what proportion of overall execution time a certain family of functions were taking, and a breakdown between these functions. GHC's normal time profiling was not appropriate for a few reasons:
- Assigning manual cost centers to the family of functions of interest would have been tricky for technical reasons: they were not separate named functions but one class-overloaded function and we wanted to count each instance separately.
- The application had some parts heavily optimized already, and the instrumentation added by using a profiling build would skew the results too much.
- The program took a long time to run as it was; enabling profiling would make the edit-run development cycle too slow.
The overhead added by enabling the eventlog is negligible however. Moreover,
we can easily use traceEvent to label the execution of our class-overloaded
function for each of its various instances (like we did in the fib example,
above). The totals reported by ghc-events-analyze enabled us to easily get
the total time taken by this family of functions and the breakdown by instance,
and to guide our subsequent improvements (like normal profiling would).
GC    25421789435ns   25.422s
A-X   53959674392ns   53.960s

DETAILED BREAKDOWN
T     10574202528ns   10.574s
F      5776369439ns    5.776s
D      4389066320ns    4.389s
A      3939896208ns    3.940s
K      3135897321ns    3.136s
Q      2706127000ns    2.706s
O      2586121945ns    2.586s
W      2295049375ns    2.295s
C      2198859200ns    2.199s
R      1791326834ns    1.791s
X      1734910406ns    1.735s
V      1727701880ns    1.728s
B      1709562291ns    1.710s
E      1385853161ns    1.386s
P      1383600793ns    1.384s
S      1165241932ns    1.165s
H      1128639979ns    1.129s
M       860537704ns    0.861s
L       810106269ns    0.810s
I       691345817ns    0.691s
U       595493497ns    0.595s
N       499041244ns    0.499s
G       462912372ns    0.463s
J       411810877ns    0.412s
We have replaced the real names from this program with labels A–X. By
comparing the overall execution time excluding GC (which we get from +RTS -s)
we can see that the total of all these calls made up the vast majority of the
program execution time. So this tells us that we don't need to worry about
optimising the rest of the program and can concentrate on this family of
functions. We can also see that the top few most expensive variants of the
function account for the majority of that time. Thus we were able to focus our
attention on the parts of the code where there was greatest opportunity to make
improvements.
In this case the visualization of CPU usage over time does not tell us much extra:
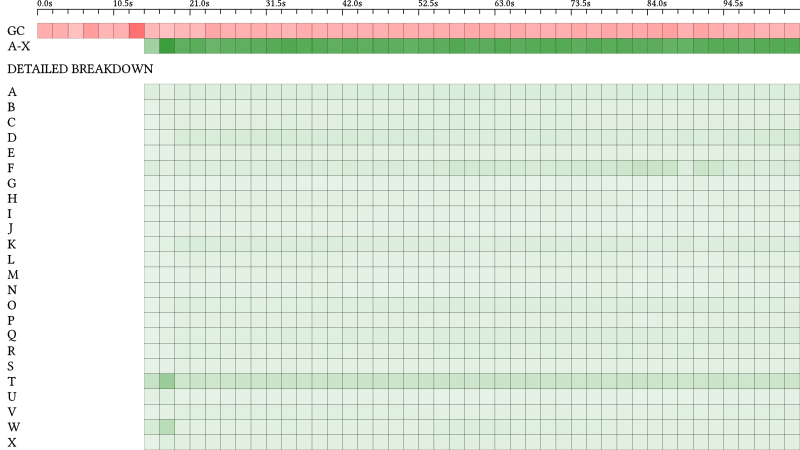
except that our family of functions are indeed busy very consistently after an initial setup (at about 60% of CPU, with the garbage collector running at about 25% CPU).
It is worth noting that when we generated the eventlog for this application
we selected only user events and GC events (+RTS -l-agu -RTS). Excluding
the thread scheduler events dramatically reduces the size of the eventlog,
which in this case would have been too big otherwise. ghc-events-analyze does
still work without the thread scheduler events being available, but you do then
miss out on the per-thread breakdown of CPU activity. Moreover, since the
creation of this diagram is relatively time consuming for large eventlogs, you
can ask ghc-events-analyze to omit it if you are interested only the totals
and the breakdown.
Availability
ghc-events-analyze is available from
Hackage; the source
code is available from github.
Patches for bug fixes or feature enhancements are welcome! The code is written to be easily extensible with additional reports or analyses.