
ghc-debug is a debugging tool for performing precise heap analysis of Haskell programs
(for more background, check out our previous post improving ghc-debug and the Case Study: Debugging a Haskell space leak).
While doing some memory profiling for Mercury, we took the opportunity to make some much
needed improvements and quality of life fixes to both the ghc-debug set of libraries and the
ghc-debug-brick terminal user interface.
The 0.8 releases focused on improving responsiveness and usability on very large memory profiles.
In particular, ghc-debug now streams intermediate profile results, giving immediate feedback for huge heap traversals.
To summarise the improvements to ghc-debug-brick, it now:
- shows partial results, and allows heap traversals to be stopped at any moment without losing existing results;
- implements history navigation, allowing you to switch between heap profile views; and
- improves the decoding of stack frames and shows stack annotations.
Streaming of intermediate results
The ghc-debug-brick TUI is the starting point for any memory profiling with ghc-debug.
It provides useful heap traversal features, for example finding closures with certain properties (via an expressive filter system), summarising all live heap objects, or analysing thunk origins.
Most of these features need to traverse the full heap to provide a conclusive result. A summary of all live heap objects cannot be complete until the full heap has been traversed. This works fine for smaller heaps, but what if the program heap is really big? Say, more than half of system RAM? The full heap traversal will take a long time, or even worse never finish, as it may use more memory than the system can provide.
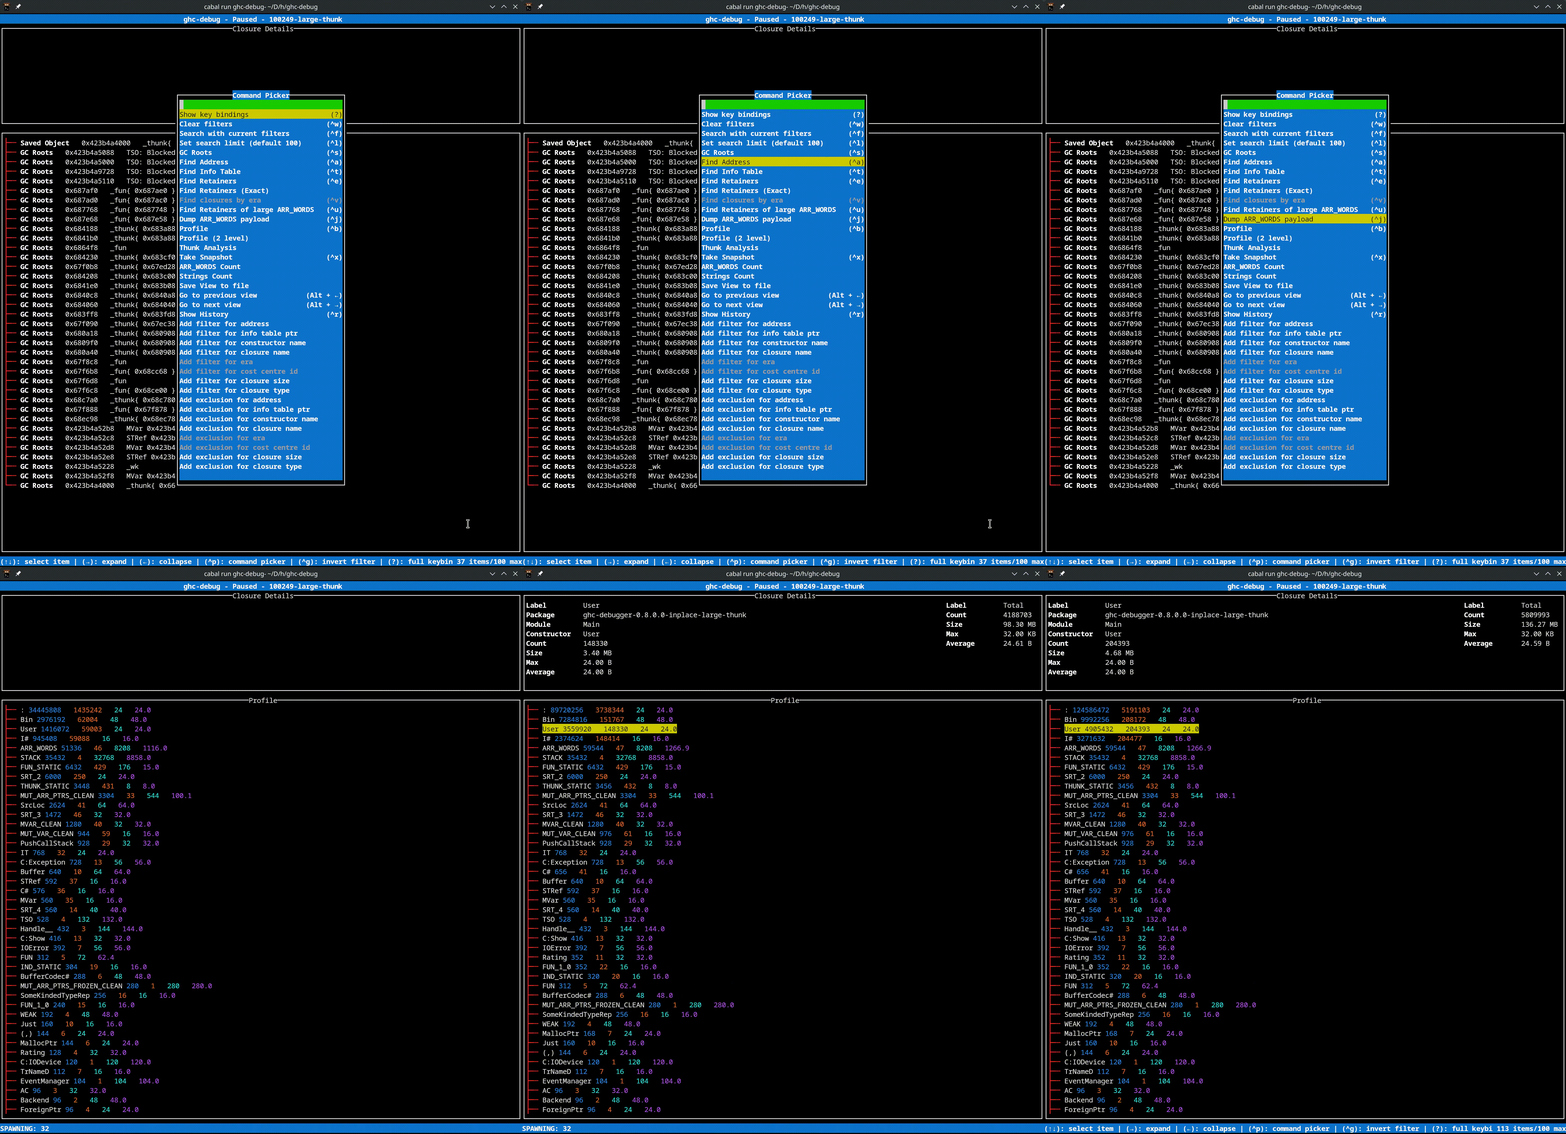
To make ghc-debug usable with large heaps, we added support for streaming of results as they come in.
No more waiting around: seconds after you start the heap traversal, the first results are shown on the screen.
While you wait for more results, you can interact with the profile in a limited way.
If you think you’ve gathered enough data, you can stop the heap traversal by pressing ESC and then explore retainers and fields, or start a different heap traversal.
Note that a stopped traversal can’t be resumed, and you have to start from scratch to find more results. There are currently no plans to add support for resuming a stopped traversal, as this would be complex to implement and can quickly leak a lot of memory when accumulating multiple partial queries.
All ghc-debug-brick heap traversals support this form of streaming/incremental results.
While ghc-debug can be slow because the heap traversals are slow, it now feels much more responsive and more rewarding to work with large heaps.
History navigation
Heap traversals are expensive and take time, but ghc-debug-brick had only one view: the result of the last heap traversal.
This was a constant source of frustration when analysing huge heaps, making it tedious to make progress.
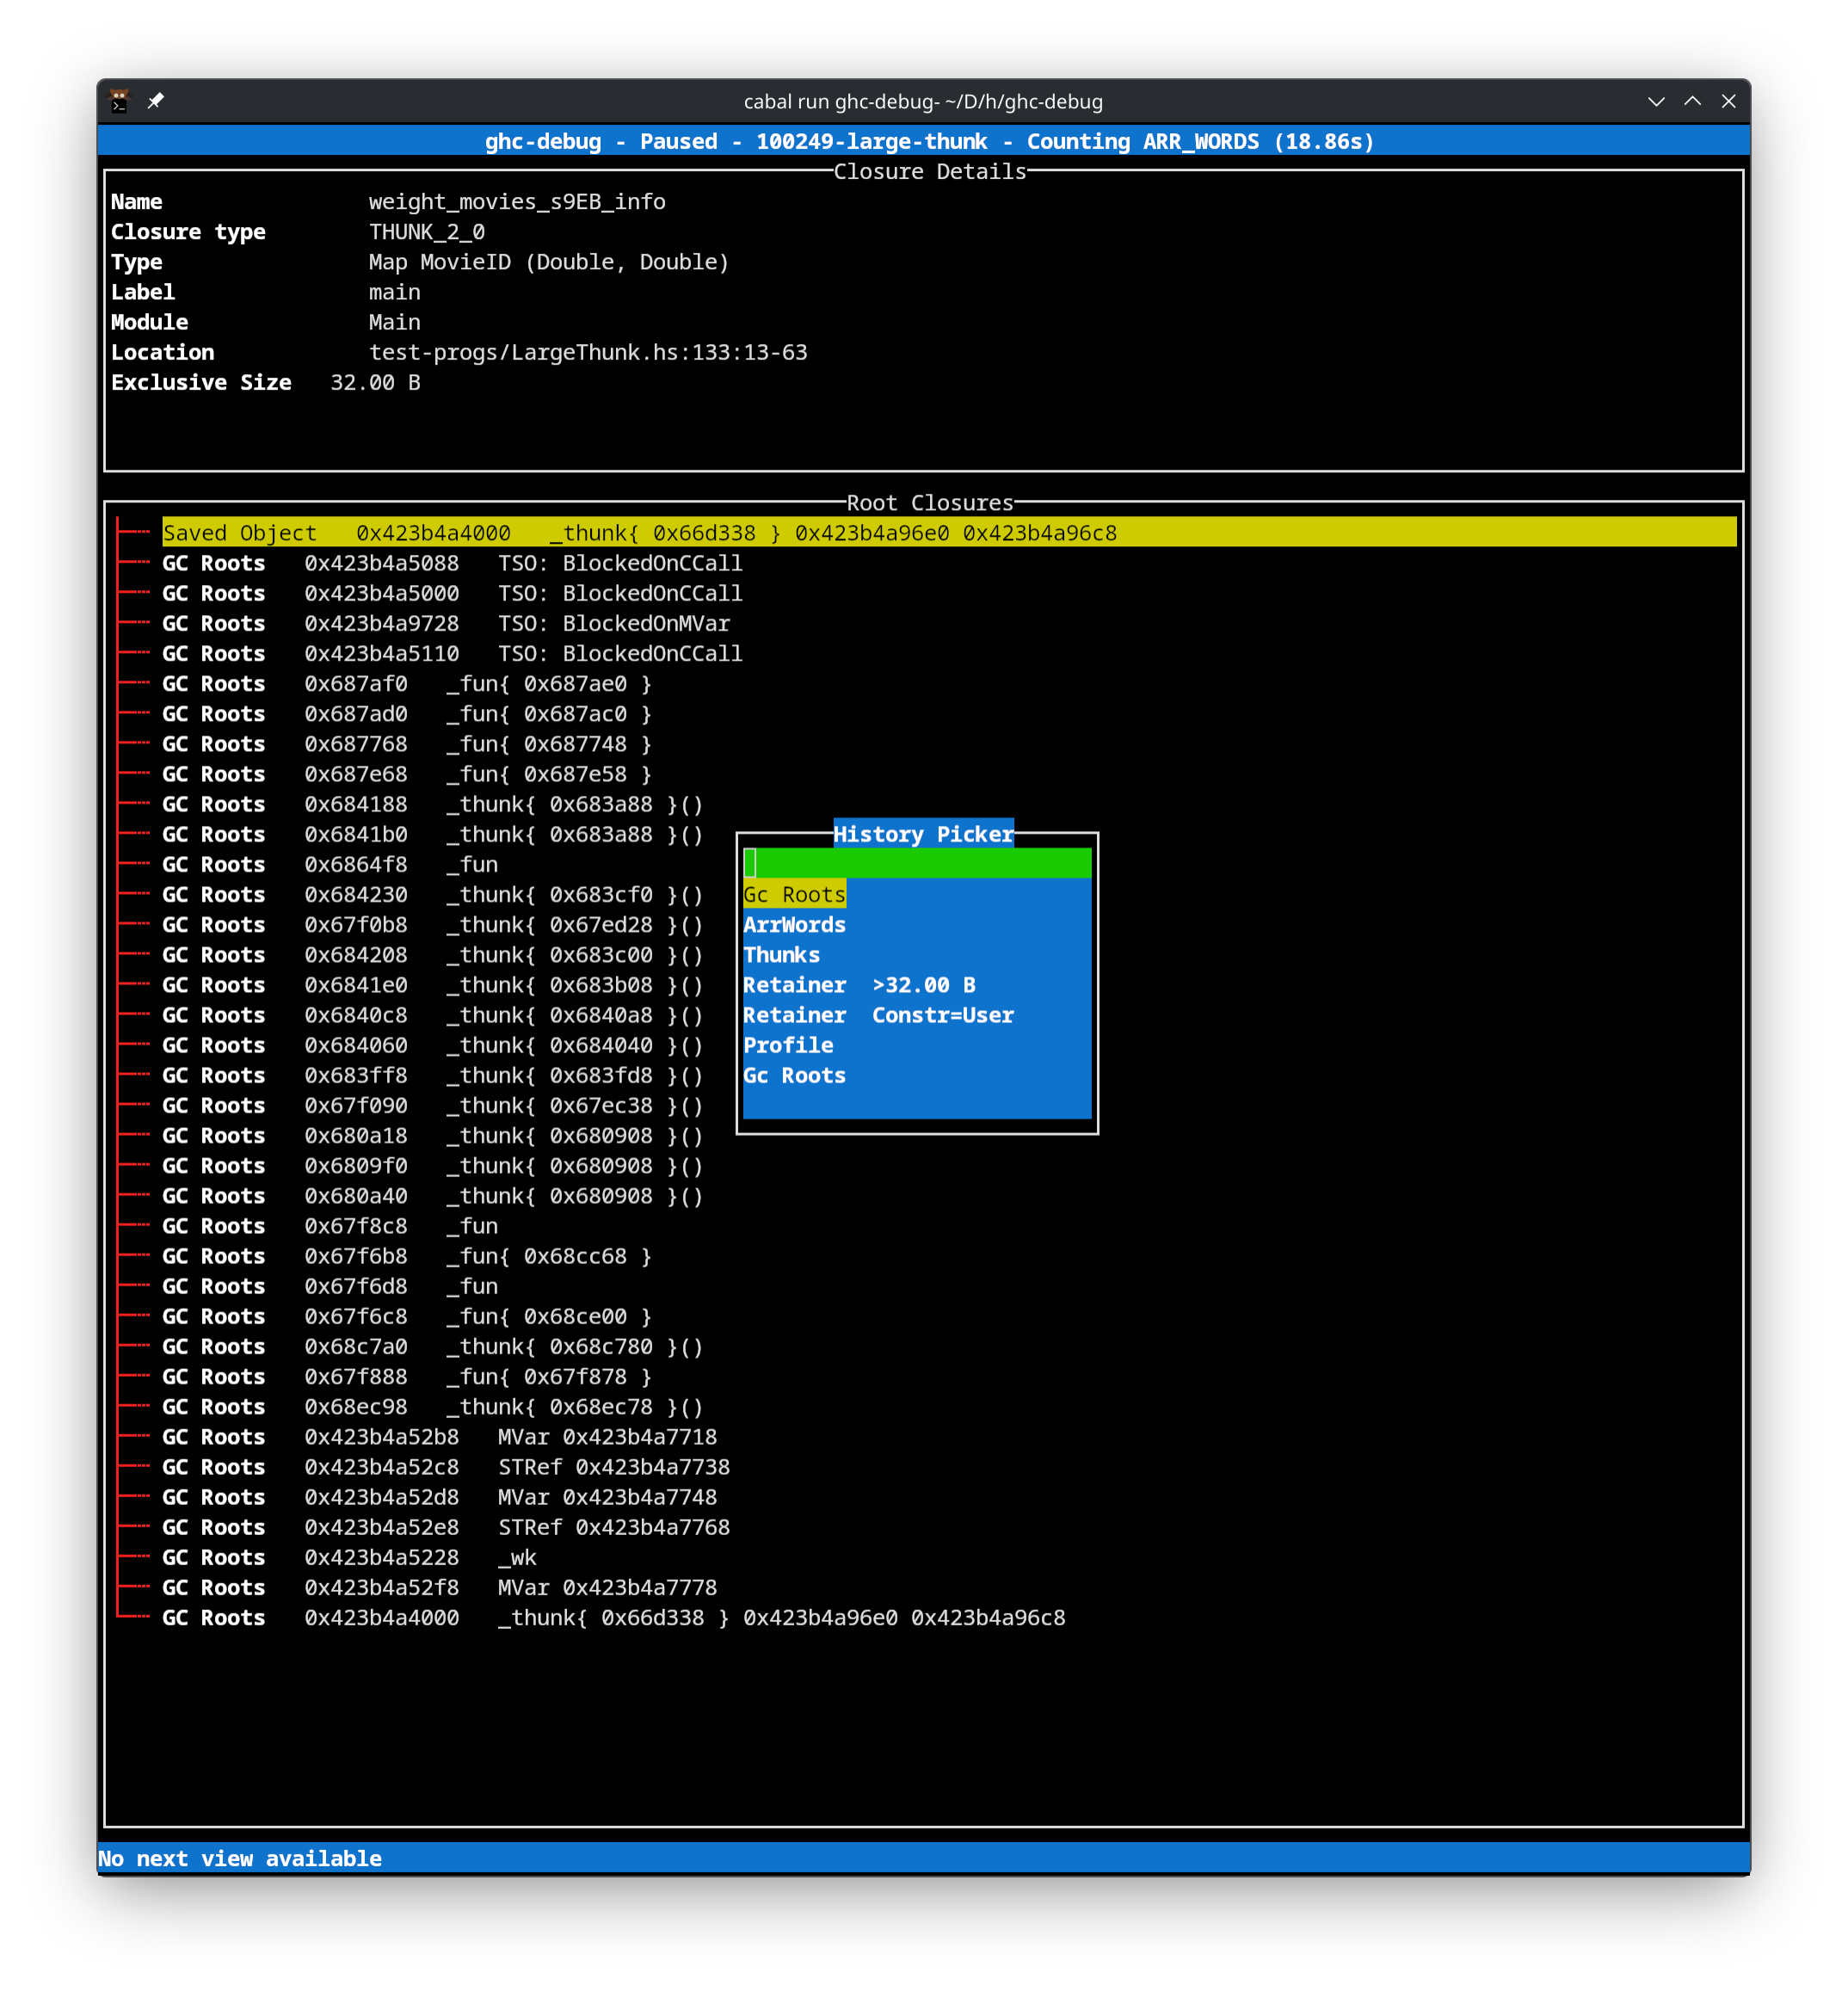
We improved this by adding a history for finished (and partial) heap traversals.
You can view the history by pressing Ctrl+r, or via the command picker, and see the results of previous queries.
The history can be navigated with Alt+Left Arrow to go back in history or Alt+Right Arrow to go forward again.
Stack decoding
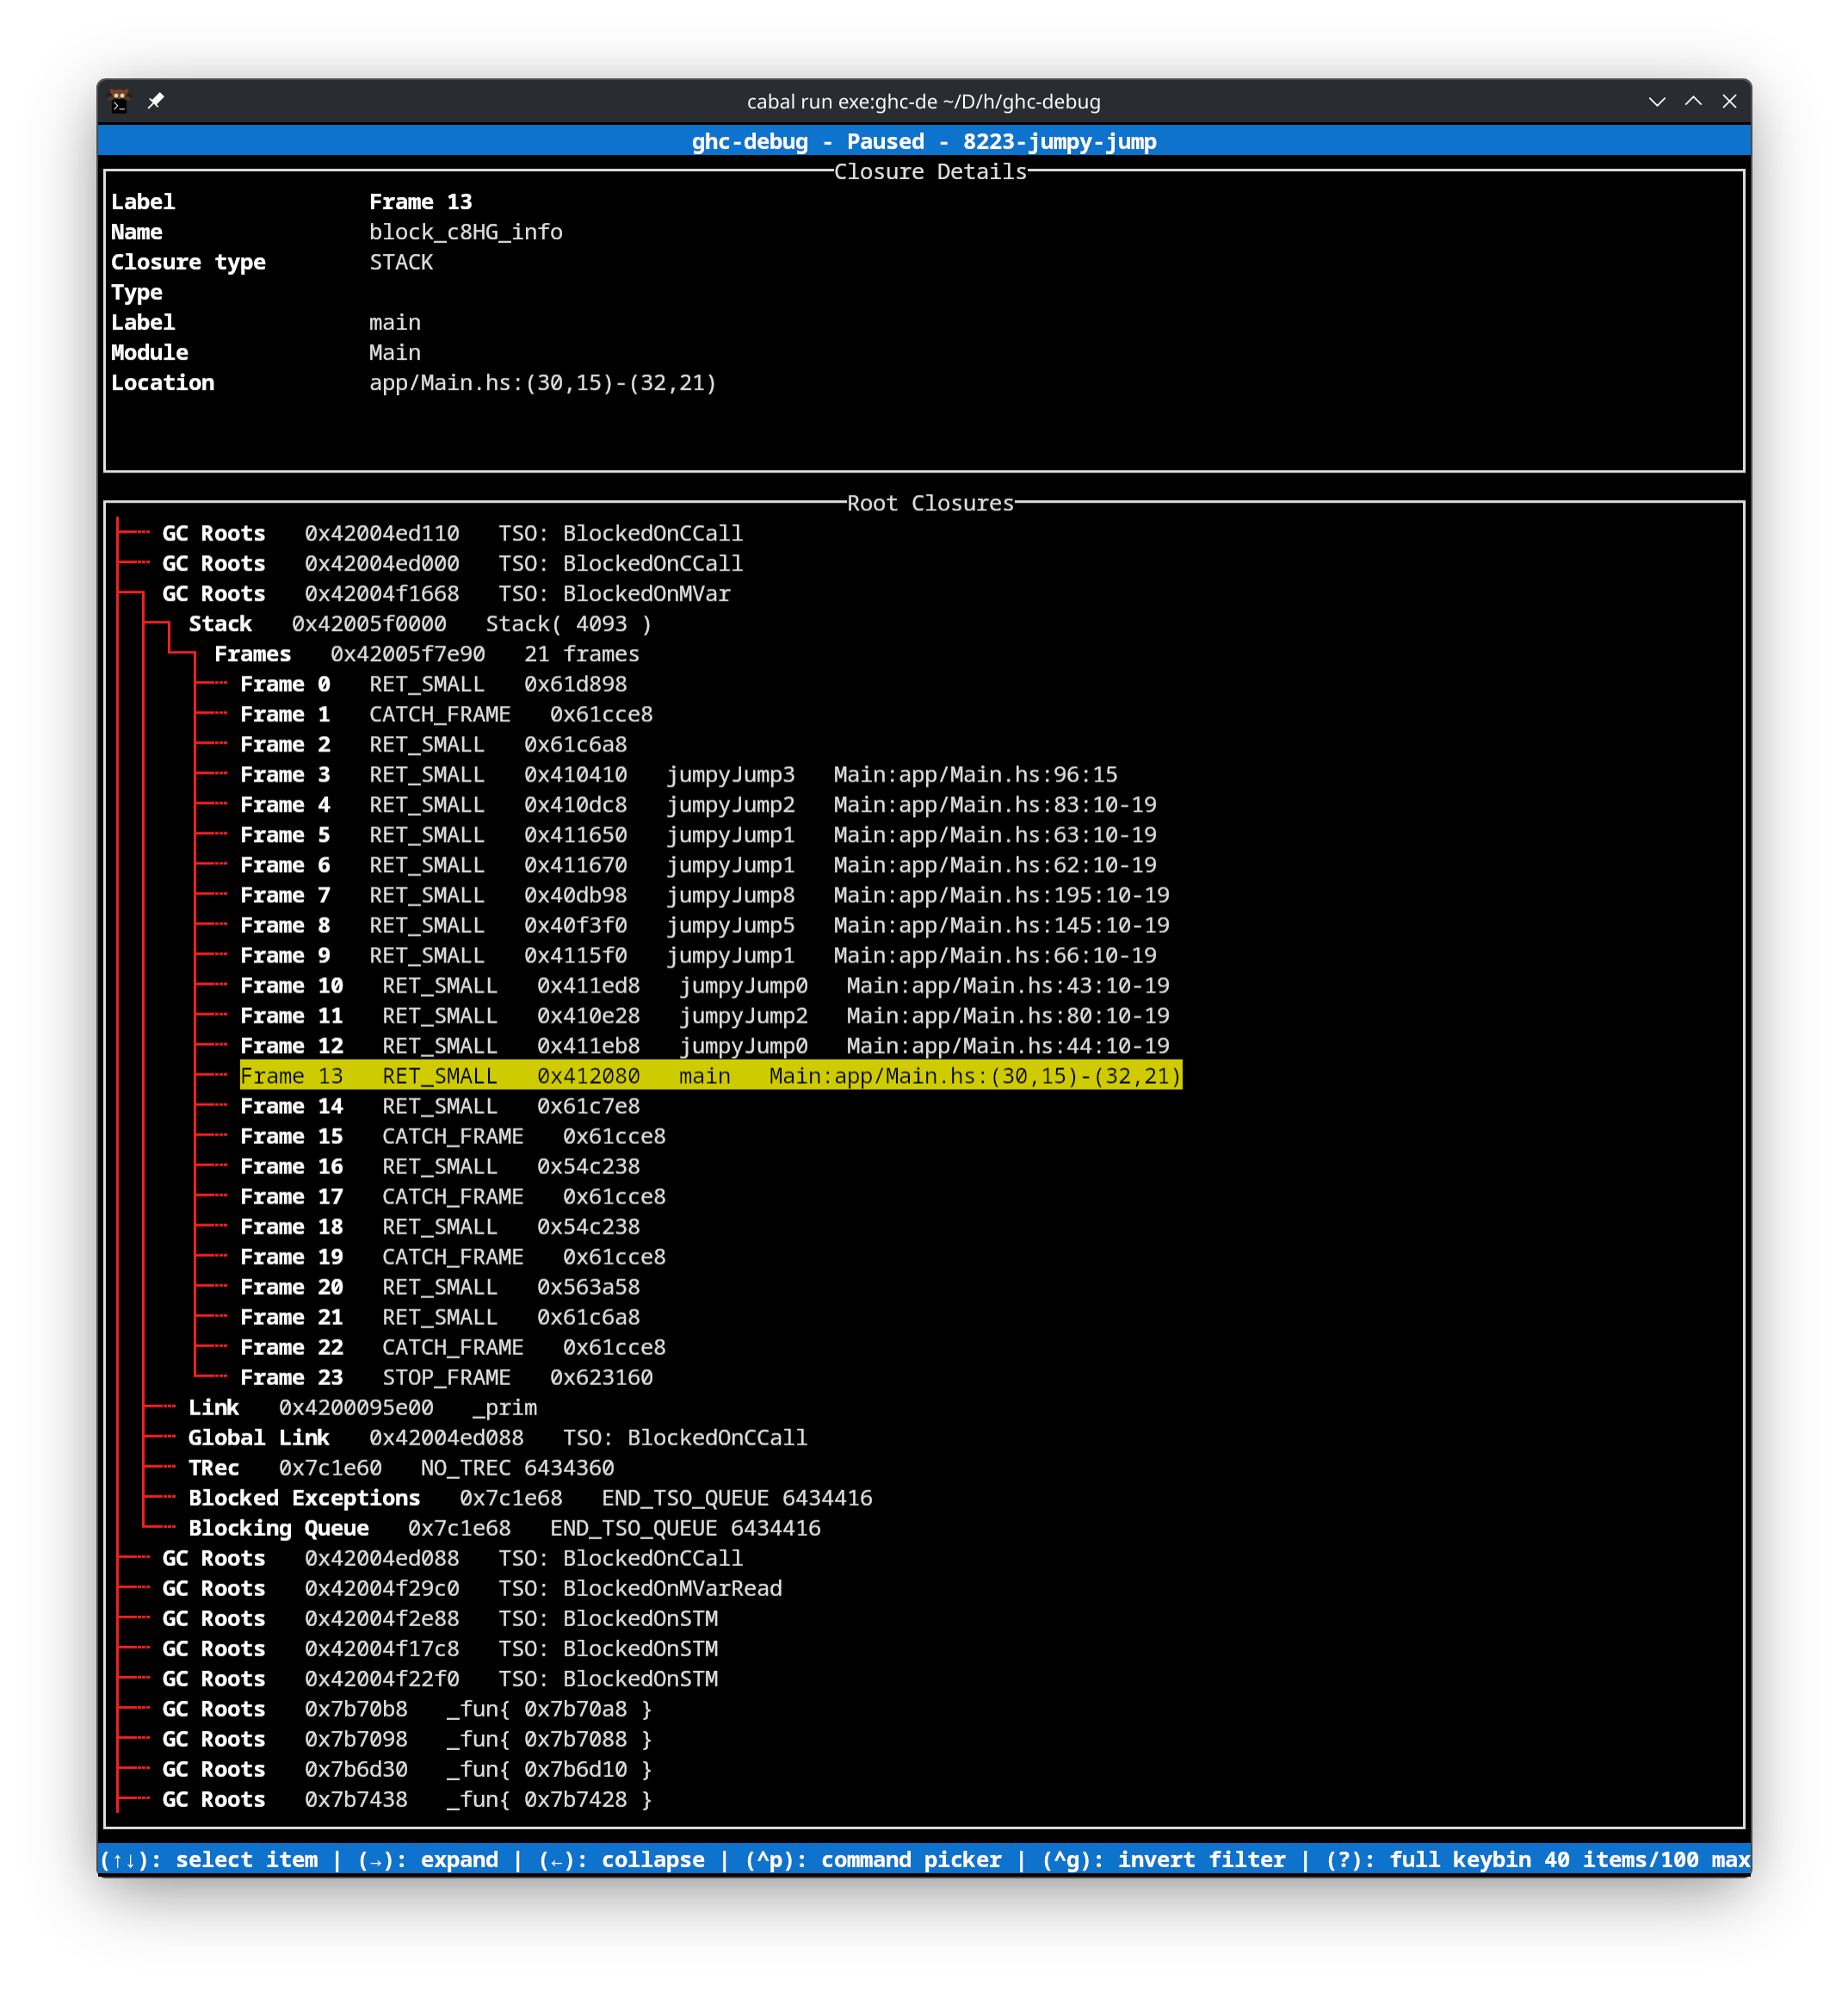
We improved the stack frame decoding logic of ghc-debug considerably, adding support for underflow frames, fixing InfoTable decoding and tidying up the rendering.
Similar to other heap closures, stack frames have source locations (info table provenance entries) attached, which help with identifying where a particular stack frame or heap object was allocated.
Stack frames themselves can be retainers of heap objects, so improving ghc-debug’s support for stack frame decoding was much-needed.
Stack annotations
We added support for stack annotations in supported GHC versions to ghc-debug.
These allow the user to annotate the native Haskell execution stack with additional metadata, such as
additional context about the current location in the source program.
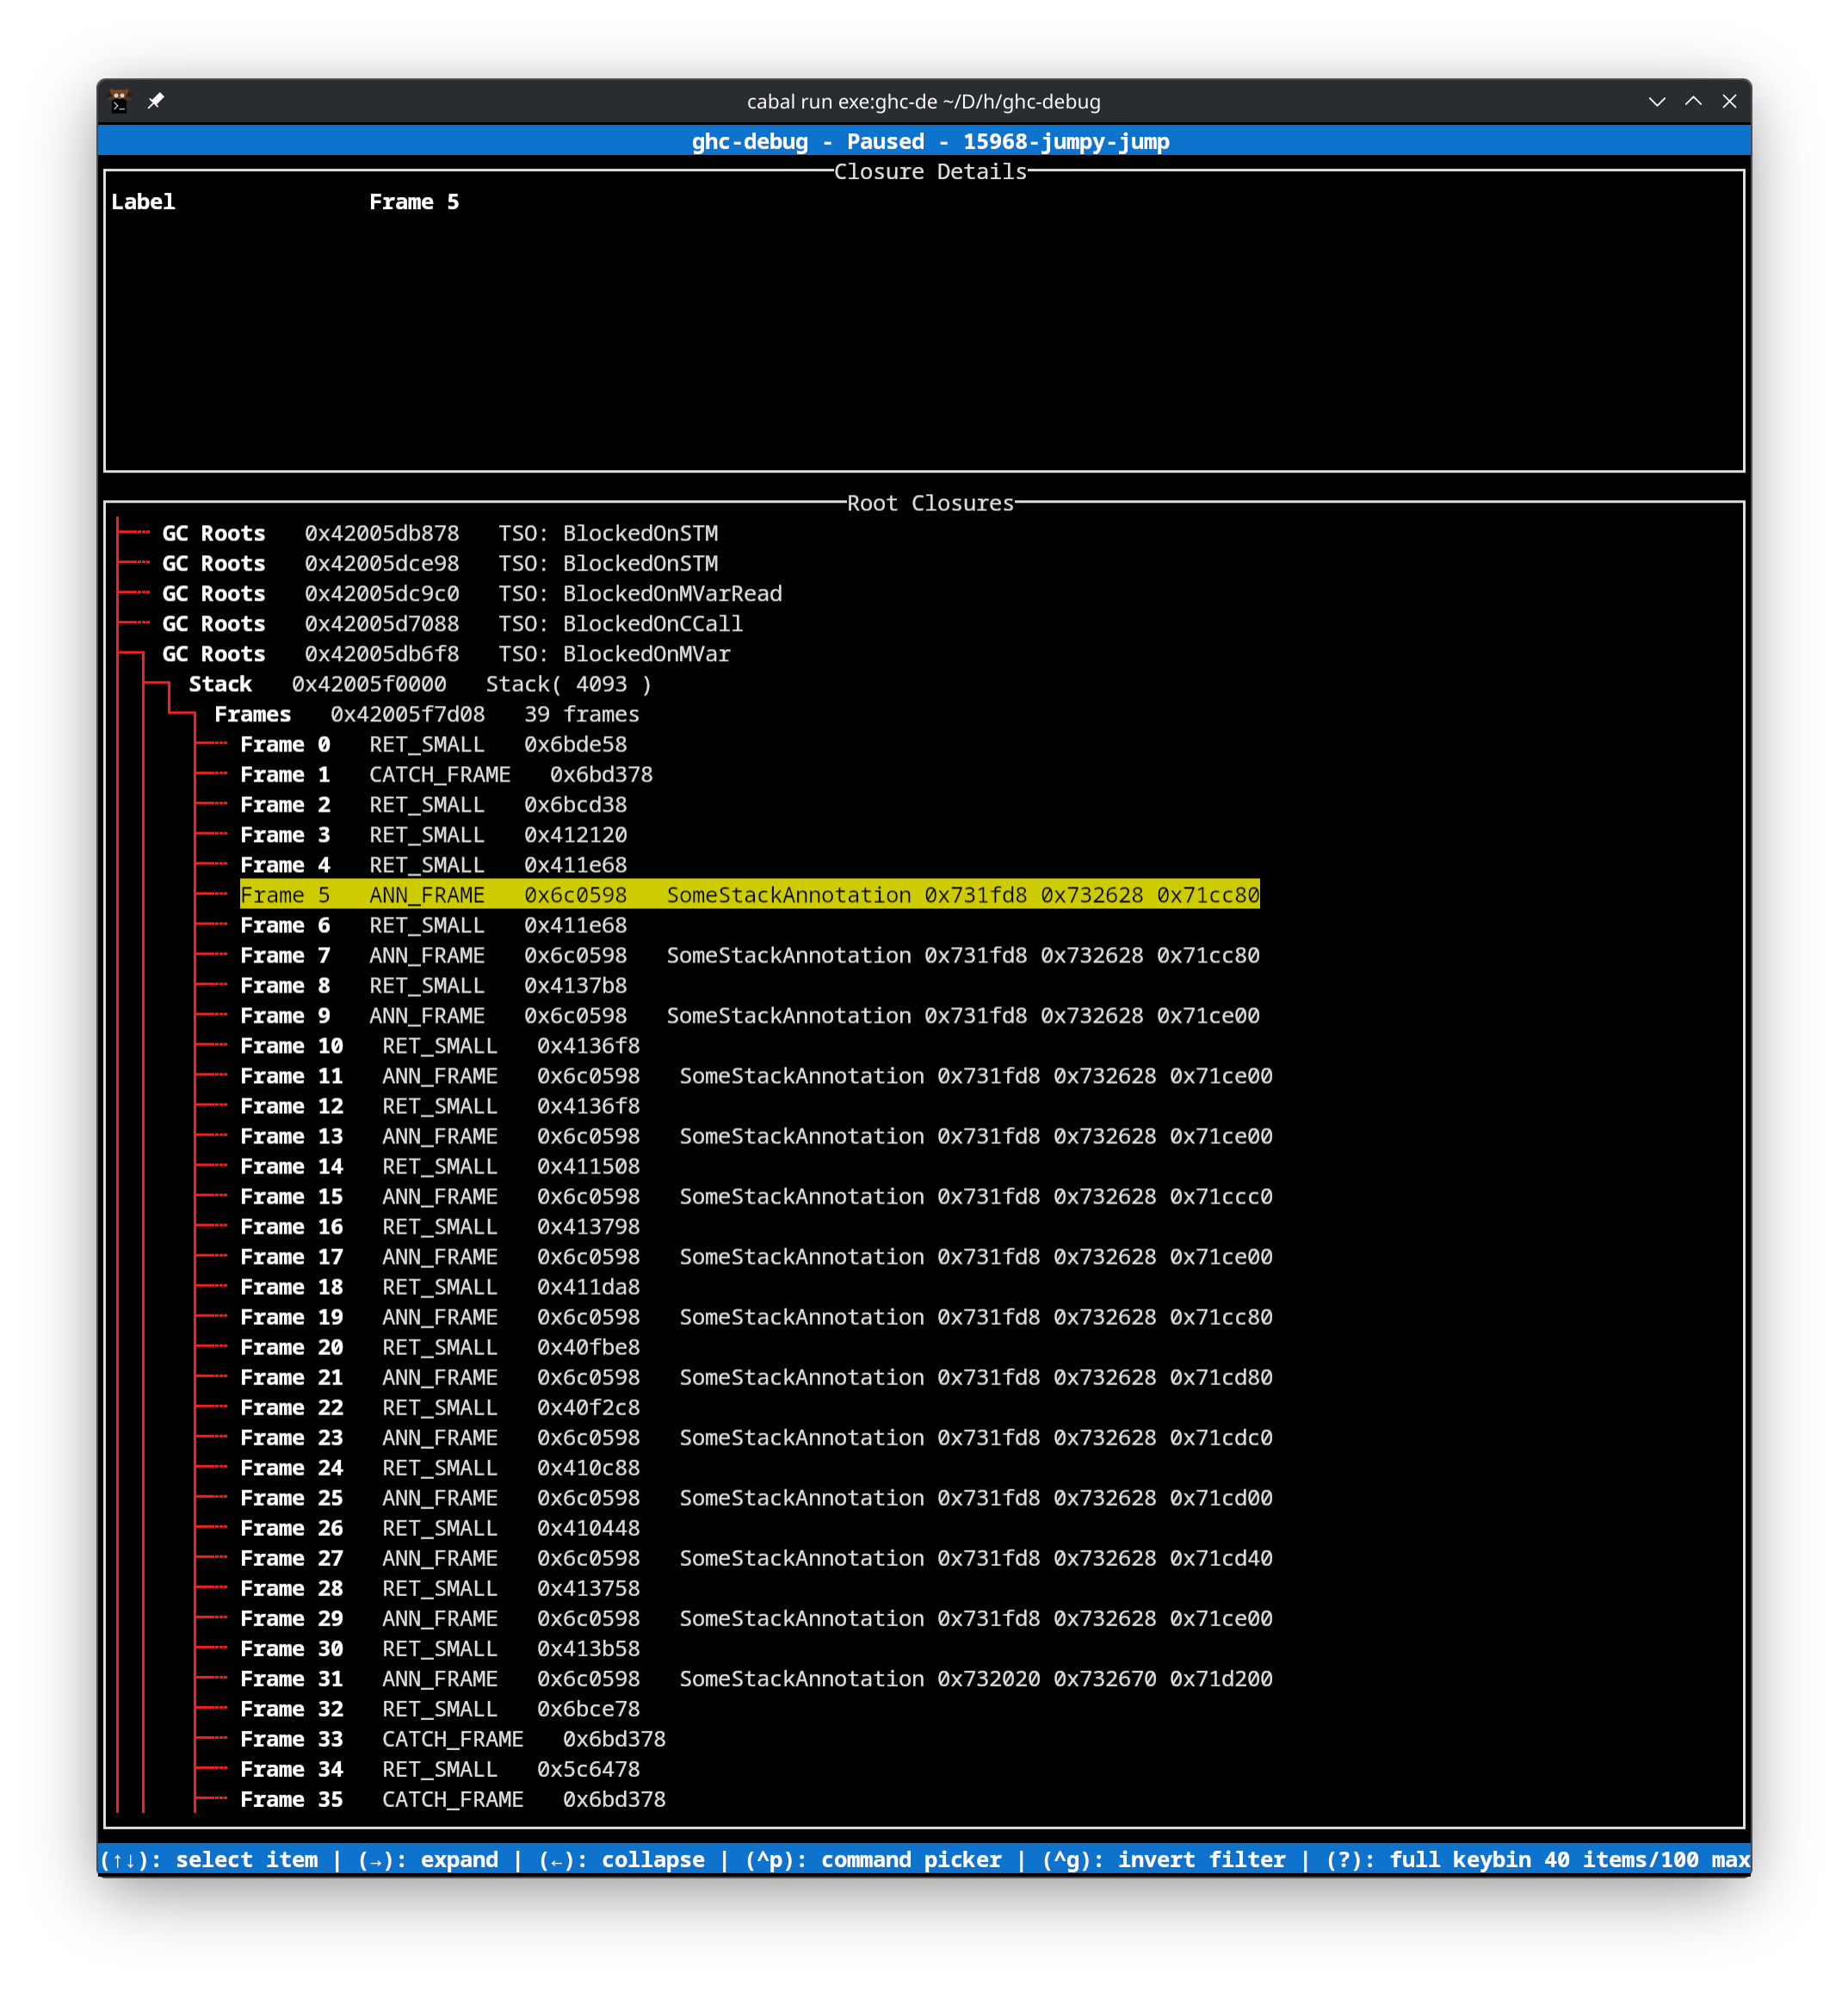
Naturally, we taught ghc-debug how to decode stack annotation frames and display them as well.
As stack annotations are themselves merely heap objects, they are represented as SomeStackAnnotation closures that you can further drill into.
Unfortunately, the annotations themselves can’t be displayed simply via the usual displayStackAnnotation rendering function, as this might evaluate thunks and change the Haskell heap.
Stack annotations help to understand complicated computation flows by adding user-defined instrumentation to the RTS stack.
They were crucial in identifying multiple bugs in ghc-debug’s stack frame decoding logic.
Conclusion
We hope that the improvements to ghc-debug and ghc-debug-brick will aid the
workflows of anyone looking to perform detailed inspections of the heap of their
Haskell processes.
The improvements should especially benefit anyone who works with large heaps.
The new features have all been released to Hackage in ghc-debug-brick-0.8.
This work has been performed in collaboration with Mercury. Mercury have a long-term commitment to the scalability and robustness of the Haskell ecosystem and are supporting the development of memory profiling tools to aid with these goals.
Well-Typed are always interested in projects and looking for funding to improve GHC and other Haskell tools. Please contact info@well-typed.com if we might be able to work with you!
Frame 0is the top of the stack, whileFrame 23is the bottom, indicated by theSTOP_FRAMEwhich is always the first stack frame on the GHC RTS stack.↩︎