
In a previous post, David explained how he analysed a memory usage issue which turned out to be caused by fragmentation. At the time of writing the exact cause of the fragmentation was unknown and difficult to analyse. The only thing that we could work out was the extent of the problem without formulating a strategy to fix it.
In this post we will report on our progress implementing ghc-debug, a tool for performing precise heap analysis, and how we have used it in order to pinpoint the cause of the fragmentation issues. ghc-debug can do a lot more than analyse fragmentation issues and we’ll briefly give a few examples in the conclusion about the full capabilities of the tool. If you’re interested in some other uses there is also a YouTube video where I demonstrated and explained more of what the tool was capable of.
A big thank you to Hasura, an open-source GraphQL engine built in Haskell, for partnering with us and making the work presented here possible. The library has also recieved contributions from Ben, David and Sven Tennie.
What is ghc-debug?
ghc-debug is a tool for analysing the heap of Haskell programs. The library works
in two parts. Firstly, ghc-debug-stub provides a wrapper function withGhcDebug
which you can wrap around the main function in your executable. Once you have
done this, when the executable starts, a socket is created which can be used to
control the process.
import GHC.Debug.Stub

main = withGhcDebug $ do ...
When a debugger starts it looks for and connects to this socket in order to take control
and analyse the running process.
A debugger is a Haskell program implemented using the ghc-debug-client API. This
might be a user-defined analysis script or some kind of frontend UI for interactive
use. In this post we will write our debuggers as specific analysis scripts. Debuggers
request information from the instrumented application by issuing requests over
the socket.
The first set of requests are to do with pausing and resuming the running process. The debugger usually starts by sending the pause request. It’s important the process is paused whilst it is being debugged as otherwise the garbage collector is free to move around objects and invalidate pointers.
-- | A request sent from the debugger to the debuggee parametrized on the result type.
data Request a where
    -- | Request protocol version
    RequestVersion :: Request Word32
    -- | Pause the debuggee.
    RequestPause :: Request ()
    -- | Resume the debuggee.
    RequestResume :: Request ()
The next set of requests are to do with getting basic information from the
process. RequestRoots will get the set of GC roots from the running process
and RequestSavedObjects will return a list of objects the user has chosen
to specially mark.
    -- | Request the debuggee's root pointers.
    RequestRoots :: Request [ClosurePtr]
    -- | A client can save objects by calling a special RTS method
    -- This function returns the closures it saved.
    RequestSavedObjects :: Request [ClosurePtr]
The final set of requests are more internal requests which are necessary to dereference pointers of different types and decode the heap representation into a Haskell data type.
    -- | Request a closure
    RequestClosure :: ClosurePtr -> Request RawClosure
    -- | Request an info table
    RequestInfoTable :: InfoTablePtr -> Request (StgInfoTableWithPtr, RawInfoTable)
The GHC.Debug.Client module provides an API to trigger these requests.
They run in the DebugM monad, which contains the state necessary for performing
and caching requests. A debugger will typical start by pausing the running process,
before requesting the gcRoots and then recursively calling dereferenceClosure
starting from the GC roots in order to analyse the heap.
pause :: Debuggee -> IO ()
resume :: Debuggee -> IO ()

gcRoots :: DebugM [ClosurePtr]
savedObjects :: DebugM [ClosurePtr]
dereferenceClosure :: ClosurePtr -> DebugM SizedClosure
You can use the run method in order to run a DebugM action.
run :: Debuggee -> DebugM a -> IO aThere are two ways which you can create a Debuggee to pass to the run
function: either by connecting to a running process or by loading and running a
snapshot. withDebuggeeConnect connects to the given socket name and runs the
provided script.
-- | Connects to a debuggee, runs the action, then closes the debuggee.
withDebuggeeConnect :: FilePath  -- ^ executable name of the debuggee
                    -> FilePath  -- ^ filename of socket (e.g. @"/tmp/ghc-debug"@)
                    -> (Debuggee -> IO a)
                    -> IO a
Snapshots can be created in order to save the state of a process and further analyse it offline. Taking snapshots is useful as then you can easily run different analysis scripts on the same snapshot without having to restart the process.
-- | Make a snapshot of the current heap and save it to the given file.
snapshot :: FilePath -> DebugM ()
snapshotRun provides a way to load a snapshot and run an analysis script only
using the snapshot. This method doesn’t connect to the process and so can be used
offline.
-- | Start an analysis session using a snapshot. This will not connect to a
-- debuggee.
snapshotRun :: FilePath -> (Debuggee -> IO a) -> IO a
There are quite a few more useful library functions in the API but this gives a taste about the fundamental parts of the library.
Charactising Fragmentation
Now that we have assembled a toolkit for working out information about the heap we want to use it in order to analyse our problem with fragmentation. We will approach the problem firstly from a high level and get progressively more detailed in the analysis.
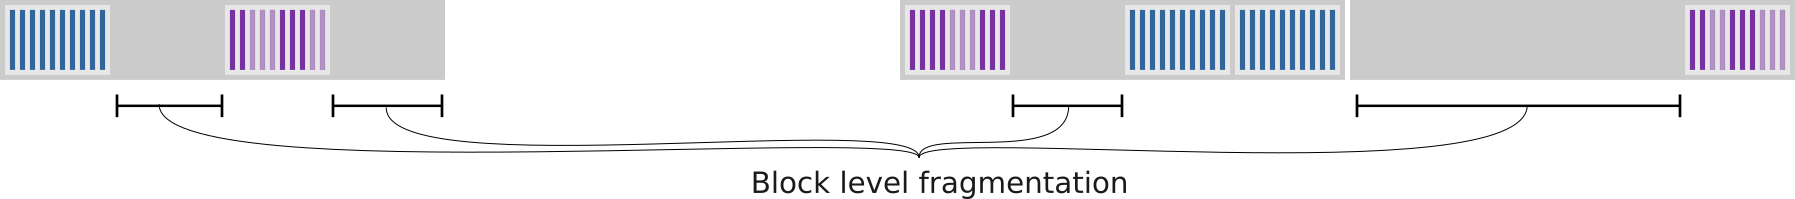
In the previous post David explained that the primary kind of fragmentation which we are interested in was block fragmentation. Block-level fragmentation is the wasted space between blocks in a megablock. In Haskell applications this is typically caused by pinned objects which can’t be moved by the garbage collector.
For pinned data, it is easy to get into situations where a small pinned object can end up retaining a large amount of memory. For example, a single pinned block, which only contains one live pinned object, can end up retaining an entire megablock. The copying GC is not capable of reusing freed space in pinned blocks and unlike unpinned blocks, fragmented blocks are not compacted during the process of copying during garbage collection.
Fragmentation is worse if there are a lot of short-lived small allocations as the surviving longer lived allocations will reside in emptier blocks once the rest of the previously live data is collected.
Block Statistics
As a bit of a warm-up let’s first consider how to write a program which analyses how many blocks, pinned blocks and megablocks are allocated. This will be enough to see that we have a problem with fragmentation.
p1 :: Debuggee -> IO ()
p1 e = do
  pause e
  bs <- run e precacheBlocks
  summariseBlocks bs
  resume e
p1 is an example script which pauses a process, queries it for the list of
blocks and then prints a simple summary of the blocks. The precacheBlocks
function fetches the list of blocks from the paused process and additionally
populates a cache which makes subsequently decoding closures much faster.
-- | Print a summary of the given raw blocks
-- This is useful to see how many MBlocks and how many pinned blocks there
-- are.
summariseBlocks :: [RawBlock] -> IO ()
summariseBlocks bs = do
  putStrLn ("TOTAL BLOCKS: " ++ show $ length bs)
  putStrLn ("PINNED BLOCKS: " ++ show $ (length $ filter isPinnedBlock bs))
  putStrLn ("MBLOCK: " ++ show n_mblocks)
  where
    n_mblocks :: Int
    n_mblocks = length (nub (map (blockMBlock . rawBlockAddr) bs))
The summary first prints the total number of blocks. Secondly, the total number of pinned blocks and thirdly the total number of megablocks.
One iteration of the benchmark we are using creates 2000 connections to the server and then releases all the connections. Looking at the heap profile for this case, the live memory usage as reported by GHC is the same before and after the benchmark runs. Analysis by David has showed that the OS reports a large difference in memory usage before and afterwards which he attributed to fragmentation.
Running p1 on our benchmark, it confirms
our suspicions that the heap is badly fragmented after running one iteration.
Before the benchmark runs, the summary reports:
TOTAL BLOCKS: 10944
PINNED BLOCKS: 90
MBLOCK: 60
After the benchmark, the number of megablocks and blocks have both increased, as well as the number of pinned blocks.
TOTAL BLOCKS: 11172
PINNED BLOCKS: 299
MBLOCK: 163
Now there are 100 more live megablocks and 200 more live pinned blocks. Each megablock is 1mb big so this accounts for the 100mb of discrepency between the memory usage reported by the OS and memory usage reported by the heap profiler.
Now the fragmentation can be seen with our own eyes! Time to delve a little deeper.
Block Histogram
In order to characterise fragmented memory we will write a custom heap analysis using ghc-debug. The heap analysis works by traversing the heap starting from the root objects and recording the block which each pinned object is allocated into. Once the traversal has finished, the total size of the live objects in a block is divided by the maximum size for the block. In an ideal world, you would want each block to be as full as possible. In a fragmented heap, most pinned blocks are less than 10% full. The code for this custom analysis is straightforward to write using some library functions.
In the GHC.Debug.Profile module there is a helper function closureCensusBy
which simplifies implementing a parallel heap census.
closureCensusBy :: forall k v . (Semigroup v, Ord k)
                => (ClosurePtr -> SizedClosure -> DebugM (Maybe (k, v)))
                -> [ClosurePtr]
                -> DebugM (Map.Map k v)
To closureCensusBy you provide a continuation which will be used to classify
each closure as it is visited during the traversal. If the classification function
returns Just a key-value pair then the result is added into the census summary.
The result is returned in a Map which is segmented by the reported keys.
For the block census, the classification needs to achieve two things, firstly check if the object is allocated into a pinned block and then add the size to the appropiate bucket if it is pinned.
The result of this analysis is going to be a map from the block pointer
to PinnedCensusStats, which is normal statistics about a census (total size,
count of objects and so on) along with actual pinned objects we found in each
pinned block. This will be useful later. In order to use it with the generic
closureCensusBy it needs to be an instance of Semigroup.
data CensusStats = CS { n :: !Count, cssize :: !Size, csmax :: !(Max Size) }

newtype PinnedCensusStats = PinnedCensusStats (CensusStats, [(ClosurePtr, SizedClosure)]) deriving (Semigroup)
Then onto the analysis function, which provides the right continuation to
closureCensusBy to perform the previously described census. The
function takes a list of all blocks in the program which is filtered to
just leave the pinned blocks. If a visited closure is in one of
these pinned blocks then the value is added into the census.
censusPinnedBlocks :: [RawBlock]
                   -> [ClosurePtr]
                   -> DebugM (Map.Map BlockPtr PinnedCensusStats)
censusPinnedBlocks bs = closureCensusBy go
  where
    pbs :: Set.Set BlockPtr
    pbs = Set.fromList (map rawBlockAddr (filter isPinnedBlock bs))

    go :: ClosurePtr -> SizedClosure
          -> DebugM (Maybe (BlockPtr, PinnedCensusStats))
    go cp d =
      let cs :: CensusStats
          cs = CensusStats (Count 1) (dcSize d) (Max (dcSize d))

          bp :: BlockPtr
          bp = applyBlockMask cp

      in return $ if bp `Set.member` pbs
           then Just (bp, PinnedCensusStats (cs, [(cp, d)]))
           else Nothing
It only took a short amount of code in order to write this custom analysis to look into fragmentation. This function is now assembled into our second analysis script:
p2 :: Debuggee -> IO ()
p2 e = do
  pause e
  census <- run e $ do
    bs <- precacheBlocks
    roots <- gcRoots
    censusPinnedBlocks bs roots
  resume e
  printBlockHistogram census
Once the fragmentation per pinned block is calculated, the information is displayed
in a histogram which shows the percentage each block is utilised. The printBlockHistogram
function is provided by ghc-debug to print the census but omitted for brevity.
Before the benchmark runs, most blocks are quite full. Fragmentation hasn’t occurred yet. Some blocks are bigger than 100% because large objects are also pinned and may be larger than a block.
0.0%-10.0%: 7
10.0%-20.0%: 1
20.0%-30.0%: 3
30.0%-40.0%: 3
40.0%-50.0%: 3
50.0%-60.0%: 2
60.0%-70.0%: 7
70.0%-80.0%: 15
80.0%-90.0%: 16
90.0%-100.0%: 11
200.0%-210.0%: 2
510.0%-520.0%: 1
5290.0%-5300.0%: 2
After the benchmark has finished running, there are many more blocks which are less than 10% full.
0.0%-10.0%: 174
10.0%-20.0%: 5
20.0%-30.0%: 2
30.0%-40.0%: 5
40.0%-50.0%: 6
50.0%-60.0%: 18
60.0%-70.0%: 9
70.0%-80.0%: 12
80.0%-90.0%: 16
90.0%-100.0%: 11
150.0%-160.0%: 2
200.0%-210.0%: 2
510.0%-520.0%: 2
5290.0%-5300.0%: 2
This information gives us a bigger handle on what’s going on with our memory. Now it’s time to work out what live data is in the badly fragmented blocks and whether there is anything we can do to stop the blocks being retained.
Analysing Fragmentation
Now we have a better handle on the level of fragmentation and can observe exactly how badly fragmented the heap is, we are in a position to improve the situation.
One way to improve the fragmentation is to stop retaining as many pinned objects. We’ll concentrate on the badly fragmented blocks, as those will yield the biggest gains. Therefore we want to record which live objects live in the worst fragmented blocks and then look at why they are being retained. With this precise knowledge and some domain knowledge we should be able to work out if we can do anything about the fragmentation.
Remembering the previous section, the censusPinnedBlocks function already returned
the address of objects which were resident in each pinned block. Now it’s time to
use that information.
- Find all the objects allocated in the blocks which are less than 10 % used.
- For a sample of 5 objects, find one path from a GC root which retains each of them. This gives us a good idea about where the objects came from.
The information about the objects which live in the fragmented blocks is already
present in the result returned by censusPinnedBlocks. The pointers in
the fragmented blocks are identified and 5 are sampled for which we will
compute a retainer path.
It was straightforward to implement another traversal mode in ghc-debug which
computed the retainer paths for a specific object. Looking at these paths is
enlightening as we can finally see exactly where the problem is.
The findRetainersOf function takes an optional search limit, a list of targets
to find paths to and a list of roots to start looking from. The result is a list
of paths from a root to a target.
findRetainersOf :: Maybe Int -- ^ Maximum number of paths to return
                -> [ClosurePtr] -- ^ List of target closures
                -> [ClosurePtr] -- ^ List of roots to start from
                -> DebugM [[ClosurePtr]]
Given the raw paths, we can perform some further requests in order to dereference all the closures along the path and attach source location to as many closures as possible. The result is then printed so we can see what retains the fragmented objects.
Here is the first retainer stack which is reported by findRetainersOf when
supplied with the list of objects living in fragmented pinned blocks and starting
from the GC roots.
nl:toArray (8 bytes) "\NUL\NUL\NUL\NUL\NUL\NUL\NUL\NUL"
GHC.Event.IntTable:MallocPtr 0x4204d088c8 0x42069c6528
GHC.Event.IntTable:IT 0x42069c3000 0x42069c30a0 283548616920
nl:_mutVar 0x4206bf57c8
GHC.Event.Manager:STRef 0x4206bf4e88
nl:MVar 0x4206bf47b8
GHC.Event.Manager:MVar 0x42070f57e8
nl:[ 0x42070f22b0, 0x42070f22c0, 0x42070f22d0, 0x42070f22e0, 0x42070f22f0, 0x42070f2300, 0x42070f2310, 0x42070f2320, 0x42070f2330, 0x42070f2340, 0x42070f2350, 0x42070f2360, 0x42070f2370, 0x42070f2380, 0x42070f2390, 0x42070f23a0, 0x42070f23b0, 0x42070f23c0, 0x42070f23d0, 0x42070f23e0, (and more) ]
GHC.Event.Thread:_fun{0x42070f1518,0x42070f1548,0,31,77309411345,180388626452,0}
nl:Stack( 1021 )
nl:TSO
Each line is a pretty printed closure with some location information.
The line starts with the module the allocation
originated from (this uses the same machinery as the -hi profiling mode) and
is followed by the rendered closure.
The closure on each line retains the closure above it. This stack indicates that
there is a byte array consisting of 8 null bytes which is retained by something
in GHC.Event.IntTable. Further reading the callstack suggests this is related
to the GHC.Event.Manager module which is from the base libraries.
Inspecting the GHC.Event.IntTable module it can be seen that the pinned memory
is used to keep track of the size of the table. You can see it’s the tabSize field
because MallocPtr is a constructor for ForeignPtr.
newtype IntTable a = IntTable (IORef (IT a))

data IT a = IT { tabArr  :: {-# UNPACK #-} !(Arr (Bucket a))
               , tabSize :: {-# UNPACK #-} !(ForeignPtr Int)
               }
It was possible to keep track of the size without using pinned memory which led to #19171 and !4740. Thanks to Ben for offering a quick fix for this issue. Once the issue has been identified, and the usage of pinned memory eliminated then the fragmentation characteristics of the program improve.
For each pinned object it’s possible to see where the allocation arises from in a similar fashion. At this stage it’s easiest to perform an inspection by hand as the number of cases is not so large.
Conclusion
In this post we highlighted some of the high and low-level ways which ghc-debug
can be used to analyse properties of the heap of your Haskell program.
The real strength of the library is being able to quickly answer any particular questions you have yourself about your own application. It is quick and cheap to write your own analysis scripts which will answer complicated questions regarding memory usage.
To highlight the capabilities of the library we have implemented a collection
of other analysis modes. These are available in the ghc-debug-client library.
- Several heap census modes inspired by GHC’s built-in heap profiling.
ghc-debug makes it easy to tweak the census to suit your needs, for example,
we have implemented a two-level version of the
-hTprofile which allows you to distinguish between lists of different types in the census. - A “thunk analysis” mode which performs a census just of thunk closures from specific roots. This can be useful to inspect if there are any thunks in data structures for example. It is more automatic compared to using nothunks and doesn’t require any instrumentation of your existing code. (#19156, #19201)
- An analysis which detects identical duplicated objects on the heap which could be shared. This led to a number of GHC tickets (#17292, #19190, #19194).
- An implementation of the paper: Cork: Dynamic Memory Leak Detection for Garbage-Collected Languages.
- Many more domain specific analysis scripts for analysing problems in GHC, ghcide and graphql-engine which have uncovered previously hard to find problems.
The library is open-source and can be found on GHC’s gitlab server. It’s possible to try today using a suitably patched version of GHC. We hope that the library will be widely available to be used in GHC 9.2 subject to the remaining few patches getting merged.