
Sometimes OS-reported memory usage might be quite different to the live data in your Haskell program. In a couple of previous posts we’ve explored some reasons for this and shown how ghc-debug can help pinpoint fragmentation problems.
In GHC 9.2 I have made two improvements which should make the memory usage reported by long-running applications more closely line up with the amount of memory they need.
- By default a lot of extra memory was retained (up to 4 times the amount of
live data). Now idle collections will start to return some of that memory configured by
the
-Fdoption. (!5036) - Allocation of pinned objects was causing fragmentation of the nursery which could lead to the nursery retaining a lot of memory. (!5175)
In the rest of this post I will explain how to estimate the memory usage of
your program based on its amount of live data and provide some more detail about
the new -Fd option.
Inspecting memory usage
There are three metrics which are important when understanding memory usage
at a high-level. The GHC.Stats module
provides means of inspecting these statistics from inside your program, and they are
also included in the eventlog.
| Name | Description | GHC.Stats |
Eventlog |
|---|---|---|---|
| Live Bytes | The amount of live heap allocated data in your program | gcdetails_live_bytes |
HeapLive |
| Heap Size | The amount of memory the RTS is currently retaining for the Haskell heap | gcdetails_mem_in_use_bytes |
HeapSize |
| OS VmRSS | The amount of memory the OS thinks your program is using | Sample from /proc/pid/status |
– |
OS VmRSS and heap size should correspond closely to each other. If they do not then there are two likely reasons.
- It could mean that off-heap allocations (such as calls to
mallocBytesor allocations from C libraries) are contributing significantly to the resident memory of your program. You can analyse off-heap allocations using tools such as heapcheck. - By default memory is returned lazily to the OS by marking returned regions using
MADV_FREE, the memory is then free to be returned to the OS but the OS only takes it when it needs more memory. The RTS flag--disable-delayed-os-memory-returnmeans that we useMADV_DONTNEEDinstead, which promptly returns memory.
In the rest of this post I will assume that OS VmRSS and heap size are close to each other.
Understanding how Heap Size corresponds to Live Bytes
Heap size is the amount of memory that the RTS has currently allocated for the Haskell heap. There are three main factors which determine heap size.
Collection Strategy
Firstly, the garbage collection strategy used by the oldest generation requires some overhead. By default a copying strategy is used which requires at least 2 times the amount of currently live data in order to perform a major collection. For example, if your program’s live data is 1GB then the heap size needs to be at least 2GB as each major collection will copy all data into a diferent block.
If instead you are using the compacting (-c) or nonmoving (-xn) strategies
for the
oldest generation then less overhead is required as the strategy immediately
reuses already allocated memory by overwriting. For a program with live bytes
1GB then you might expect the heap size to be at minimum a small percentage above 1GB.
Nursery Size
Secondly, a certain amount of memory is reserved for the nursery. The size of
the nursery (per core) can be specified using the -A flag. By default
each nursery is 4MB so if there are 8 cores then 8 * 4 = 32MB will be
allocated and reserved for the nursery. As you increase the -A flag the baseline
memory usage will correspondingly increase.
Memory Retention Behaviour
Thirdly, after doing some allocation GHC is quite reluctant to decrease its heap
size and return
the memory to the OS. This is because after performing a major collection the program might
still be allocating a lot and it costs to have to request
more memory. Therefore the RTS keeps an extra amount to reuse which
depends on the -F ⟨factor⟩ option. By default
the RTS will keep up to (2 + F) * live_bytes after performing a major collection due to
exhausting the available heap. The default value is F = 2 so you
can see the heap size to be as high as 4 times the amount used by your
program.
Without further intervention, once your program has topped out at this high threshold, no more memory would be returned to the OS so heap size would always remain at 4 times the live data. If you had a server with 1.5G live data, then if there was a memory spike up to 6G for a short period, then heap size would never dip below 6G. This is what happened before GHC 9.2. In GHC 9.2 memory is gradually returned to the OS so OS memory usage returns closer to the theoretical minimums.
New memory return strategy in GHC 9.2
The -Fd ⟨factor⟩ option controls the rate at which the heap size is
decreased and hence memory returned to the OS.
On consecutive major collections which are not triggered by heap overflows, a
counter (t) is increased and the F factor is inversely scaled according to the
value of t and Fd. The factor is scaled by the equation:
By default Fd = 4, increasing Fd decreases the rate memory is returned.
Major collections which are not triggered by heap overflows arise mainly in two ways.
- Idle collections (controlled by
-I ⟨seconds⟩) - Explicit trigger using
performMajorGC.
For example, idle collections happen by default after 0.3 seconds of inactivity.
If you are running your application and have also set -Iw30, so that the minimum
period between idle GCs is 30 seconds, then say you do a small amount of work every 5 seconds,
there will be about 10 idle collections every 5 minutes. This number of consecutive
idle collections will scale the F factor as follows:
and hence we will only retain (0.35 + 2) * live_bytes
rather than the original 4 times. If you have less frequent idle collections (e.g. due to increasing
-I or -Iw) then
you should also decrease Fd so that more memory is returned each time
a collection takes place.
Enabling idle collections is important if you want your program to return memory
to the operating system and promptly run finalisers. In the past it has sometimes
been recommended that long running applications disable idle collections in order
to avoid unecessary work but now it is better to keep idle collections enabled but
configure the -Iw option to avoid them happening too frequently.
If you set -Fd0 then GHC will not attempt to return memory, which corresponds
with the behaviour from releases prior to 9.2. You probably don’t want to do this as
unless you have idle periods in your program the behaviour will be similar anyway.
Analysis and Further Tweaking
These two graphs show the difference between -Fd0 and -Fd4, with -Fd4 the
memory usage returns to a baseline of around 4GB after spiking at 8GB. With -Fd0,
the memory usage never retreats back below 7GB.
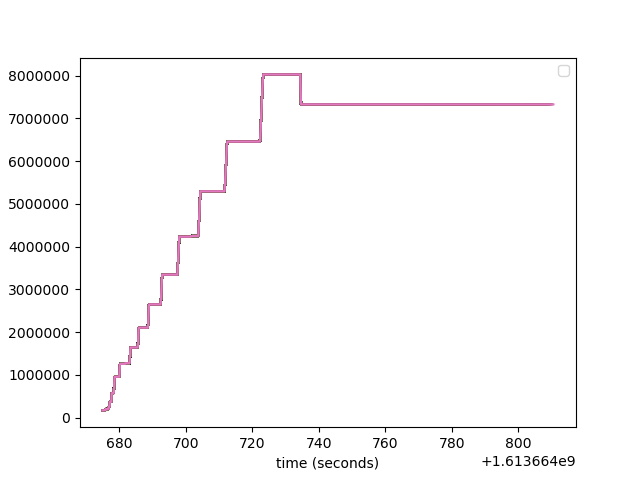
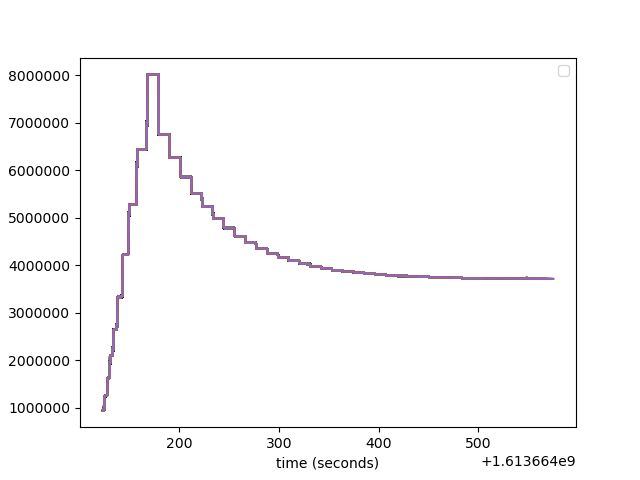
-Fd0 (left) and -Fd4 (right).
If you want to retain a specific amount of memory then it’s better to set -H1G
in order to communicate that you are happy with a heap size of 1G. If you do this
then heap size will never decrease below this amount if it ever reaches this
threshold.
The collecting strategy also affects the fragmentation of the heap and hence how easy it is to return memory to a theoretical baseline. David in a previous post gave a much more in-depth explanation of fragmentation.
In theory the compacting strategy has a lower memory baseline but practically it can be hard to reach the baseline due to how compacting never defragments. On the other hand, the copying collecting has a higher theoretical baseline but we can often get very close to it because the act of copying leads to lower fragmentation.
Conclusion
In this post I explained the new GHC option -Fd and how it can be configured
to return additional memory to the OS during idle periods. Under the default settings
this should result in a lower reported memory usage for most long-running applications
in GHC 9.2.
A big thank you to Hasura, an open-source GraphQL engine built in Haskell, for partnering with us and making the work presented here possible.