
Memory detectives now have many avenues of investigation when looking into memory usage problems in Haskell programs. You might start by looking at what has been allocated: which types of closures and which constructors are contributing significantly to the problem. Then perhaps it’s prudent to look at why a closure has been allocated by the info table provenance information. This will tell you from which point in the source code your allocations are coming from. But if if you then turned to investigate when a closure was allocated during the lifecycle of your program, you end up being stuck.
Existing Haskell heap profiling tools work by taking regular samples of the heap to generate a graph of heap usage over time. This can give an aggregate view, but makes it difficult to determine when an individual closure was allocated.
Eras profiling is a new GHC profiling mode that will be available in GHC 9.10 (!11903). For each closure it records the “era” during which it was allocated, thereby making it possible to analyse the points at which closures are allocated much more precisely.
In this post, we are going to explore this profiling mode that makes it easier
to find space leaks and identify suspicious long lived objects on the heap. We
have discussed ghc-debug before, and we are going to make use
of it to explore the new profiling mode using some new features added to the
ghc-debug-brick TUI.
Introduction to eras profiling
The idea of eras profiling is to mark each closure with the era it was allocated.
An era is simply a Word. The era can then be used to create heap profiles by
era and also inspected by ghc-debug.
To enable eras profiling, you compile programs with profiling enabled and run with the
+RTS -he option.
The era starts at 1, then there are two means by which it can be changed:
- User: The user program has control to set the era explicitly (by using functions in
GHC.Profiling.Eras). - Automatic: The era is incremented at each major garbage collection (enabled by
--automatic-era-increment).
The user mode is most useful as this allows you to provide domain specific eras.
There are three new primitive functions exported from GHC.Profiling.Eras for
manipulating the era:
setUserEra :: Word -> IO ()
getUserEra :: IO Word
incrementUserEra :: Word -> IO Word
Note that the current era is a program global variable, so if your program is multi-threaded then setting the era will apply to all threads.
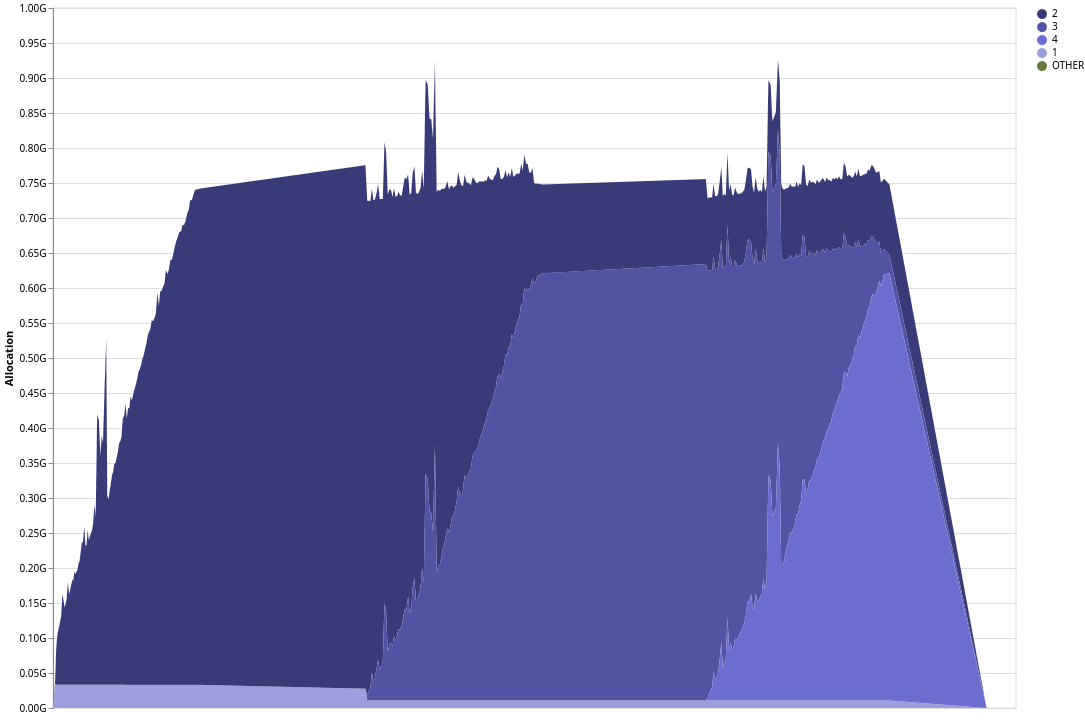
Below is an example of an eras profile rendered using eventlog2html. The eras
have been increased by the user functions, and the programmer has defined
4 distinct eras.
Diagnosing a GHCi memory leak
Recently, we came across a regression in GHCi’s memory behaviour (#24116), where reloading a project would use double the amount of expected memory. During each reload of a project, the memory usage would uniformly increase, only to return to the expected level after the reload had concluded.
Reproducing the problem
In order to investigate the issue we loaded Agda into a GHCi session and
reloaded the project a few times. Agda is the kind of project we regularly use
to analyse compiler performance as it’s a typical example of a medium size Haskell
application.
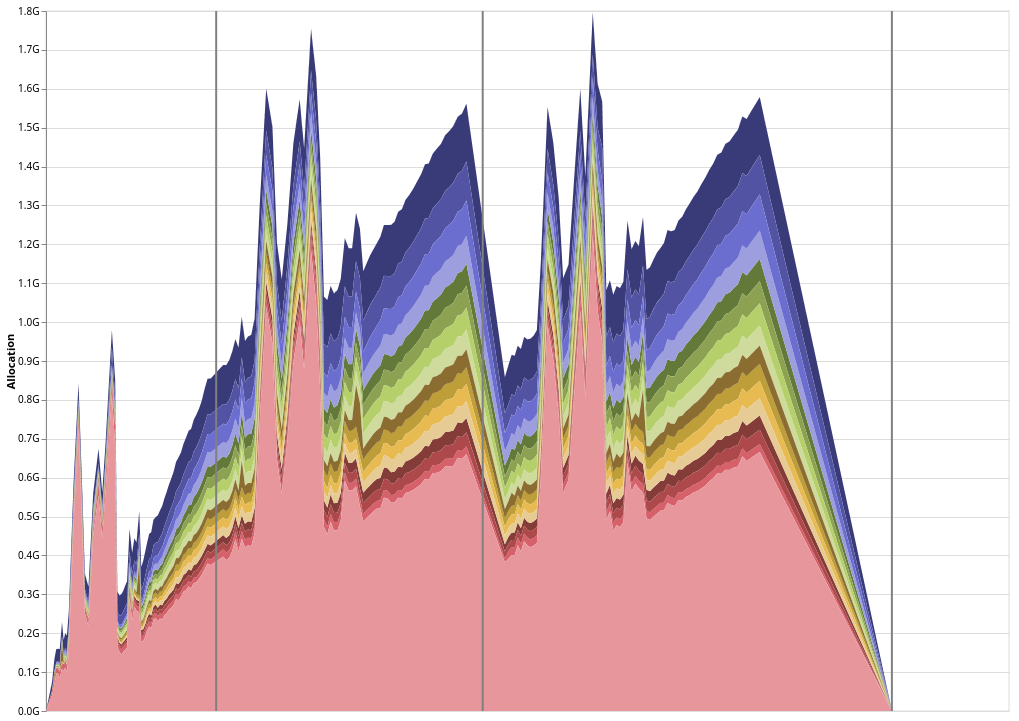
The profile starts with the initial load of Agda into GHCi, then each subsequent vertical line represents a :reload call.
We can see that while loading the project a second time, GHCi seems to hold on to all of the in-memory compilation artifacts from the first round of compilation, before releasing them right as the load finishes. This is not expected behaviour for GHCi, and ideally it should stay at a roughly constant level of heap usage during a reload.
During a reload, GHCi should either
- Keep compilation artifacts from the previous build in memory if it determines that they are still valid after recompilation avoidance checking
- Release them as soon as it realizes they are out of date, replacing them with fresh artifacts
In either case, the total heap usage shouldn’t change, since we are either keeping old artifacts or replacing them with new ones of roughly similar size. This task is a perfect fit for eras profiling, if we can get assign a different era for each reload then we should be able to easily confirm our hypothesis about the memory usage pattern.
Instrumenting GHCi
First we instrument the program so that the era is incremented on each reload. We do this
by modifying the load function in GHC to increment the era on each call:
--- a/compiler/GHC/Driver/Make.hs
+++ b/compiler/GHC/Driver/Make.hs
@@ -153,6 +153,7 @@ import GHC.Utils.Constants
 import GHC.Types.Unique.DFM (udfmRestrictKeysSet)
 import GHC.Types.Unique
 import GHC.Iface.Errors.Types
+import GHC.Profiling.Eras

 import qualified GHC.Data.Word64Set as W

@@ -702,6 +703,8 @@ load' mhmi_cache how_much diag_wrapper mHscMessage mod_graph = do
     -- In normal usage plugins are initialised already by ghc/Main.hs this is protective
     -- for any client who might interact with GHC via load'.
     -- See Note [Timing of plugin initialization]
+    era <- liftIO getUserEra
+    liftIO $ setUserEra (era + 1)
     initializeSessionPlugins
     modifySession $ \hsc_env -> hsc_env { hsc_mod_graph = mod_graph }
     guessOutputFile
Then when running the benchmark with eras profiling enabled, the profile looks as follows:
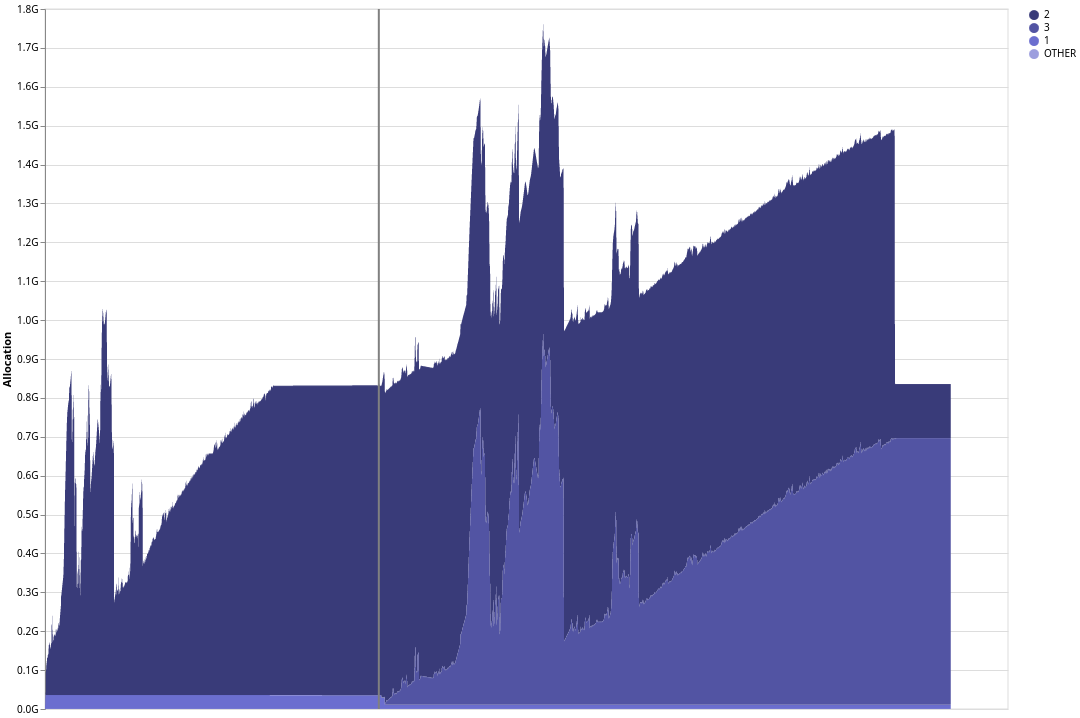
Now we can clearly see that after the reload (the vertical line), all the memory which has been allocated during era 2 remains alive as newly allocated memory belongs to era 3.
Identifying a culprit closure
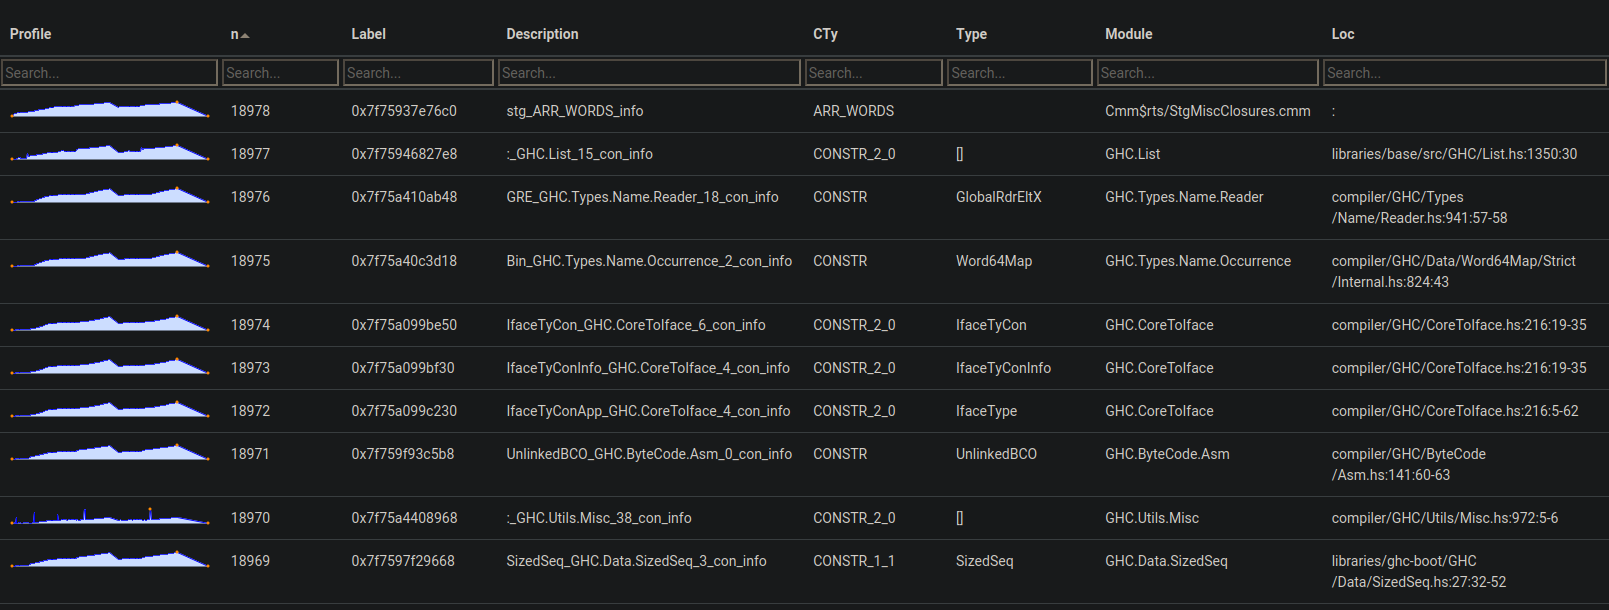
With the general memory usage pattern established, it’s time to look more closely at the culprits. By performing an info table profile and looking at the detailed tab, we can identify a specific closure which contributes to the bad memory usage pattern.
The GRE closure is one of the top entries in the
info table profile, and we can see that its pattern of heap usage matches the
overall shape of the graph, which means that we are probably incorrectly holding
on to GREs from the first round of compilation.
Now we can turn to more precise debugging tools in order to actually determine where the memory leak is.
Looking closer with ghc-debug
We decided to investigate the leak using ghc-debug. After instrumenting the GHC
executable we can connect to a running ghc process with ghc-debug-brick and explore its
heap objects using a TUI interface.
Tracing retainers with ghc-debug
To capture the leak, we pause the GHC process right before it
finished the reload, while it is compiling the final few modules in Agda. Remember that
all the memory is released after the end of the reload to return to the expected baseline.
In order to check for the cause of the leak, we do a search for the retainers of GRE
closure in ghc-debug-brick. We are searching for GRE because the info table
profile indicated that this was one type of closure which was leaking.
Before eras profiling, if we tried to use this knowledge and ghc-debug-brick to
find out why the GREs are being retained then we got a bit stuck. Looking at the
interface we can’t distinguish between the two distinct classes of live GREs:
- Fresh
GREs from the current load (era 3), which we really do need in memory. - Stale
GREs from the first load (era 2), which shouldn’t be live anymore and should have be released.
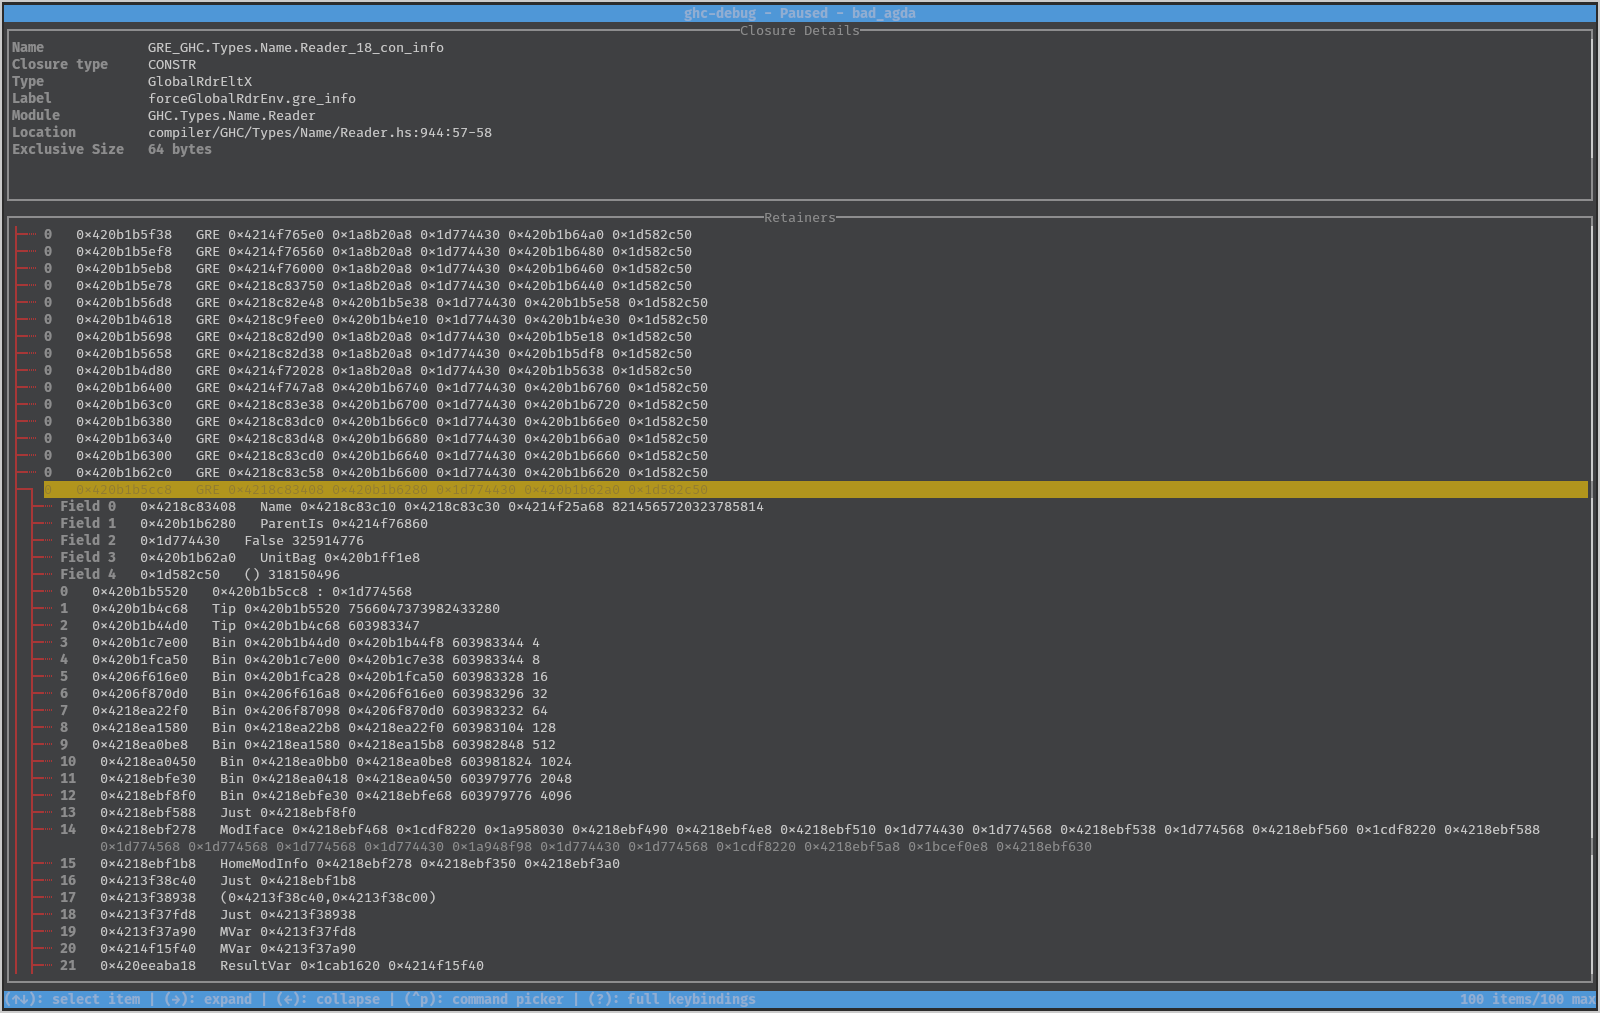
This is the retainer view of ghc-debug, where all closures matching our search
(constructor is GRE) are listed, and expanding a closure shows a tree with
a retainer stack of all the heap objects which retain the closure. Reading
this stack downwards you can determine a chain of references through which any
particular closure is retained, going all the way back to a GC root. Inspecting
the retainer stack can shed light on why your program is holding on to a
particular object.
We can try to scroll through the list of GREs in the TUI, carefully
inspecting the retainer stack of each in turn and using our domain knowledge to
classify each GRE closure as belonging to one of the two categories above.
However, this process is tedious and error prone, especially given that we have
such a large number of potentially leaking objects to inspect. Depending on the
order that ghc-debug happened to traverse the heap, we might find leaking
entries after inspecting the first few items, or we may be very unlucky and all
the leaking items might be hundreds or thousands of entries deep into the list.
ghc-debug supercharged with eras profiling
Now with eras profiling there are two extensions to ghc-debug which make it easy
to distinguish these two cases since we already distinguished the era of the objects.
- Filtering By Era: You can filter the results of any search to only include objects allocated during particular eras, given by ranges.
- Colouring by Era: You can also enable colouring by era, so that the background colour of entries
in
ghc-debug-brickis selected based on the era the object was allocated in, making it easy to visually partition the heap and quickly identify leaking objects.
So now, if we enable filtering by era, it’s easy to distinguish the new and old closures.
With the new filtering mode, we search for retainers of GREs which were allocated
in era 2. Now we can inspect the retainer stacks of any one of these closures with
the confidence that it has leaked.
Because ghc-debug-brick is also colouring by era, we can also easily identify
roughly where in the retainer stack the leak occurs, because we can see new
objects (from era 3) holding on to objects from the previous era (era 2).
We can see that a GRE from era 2 (green) is being retained, through a thunk from GHC.Driver.Make
allocated in era 3 (yellow):
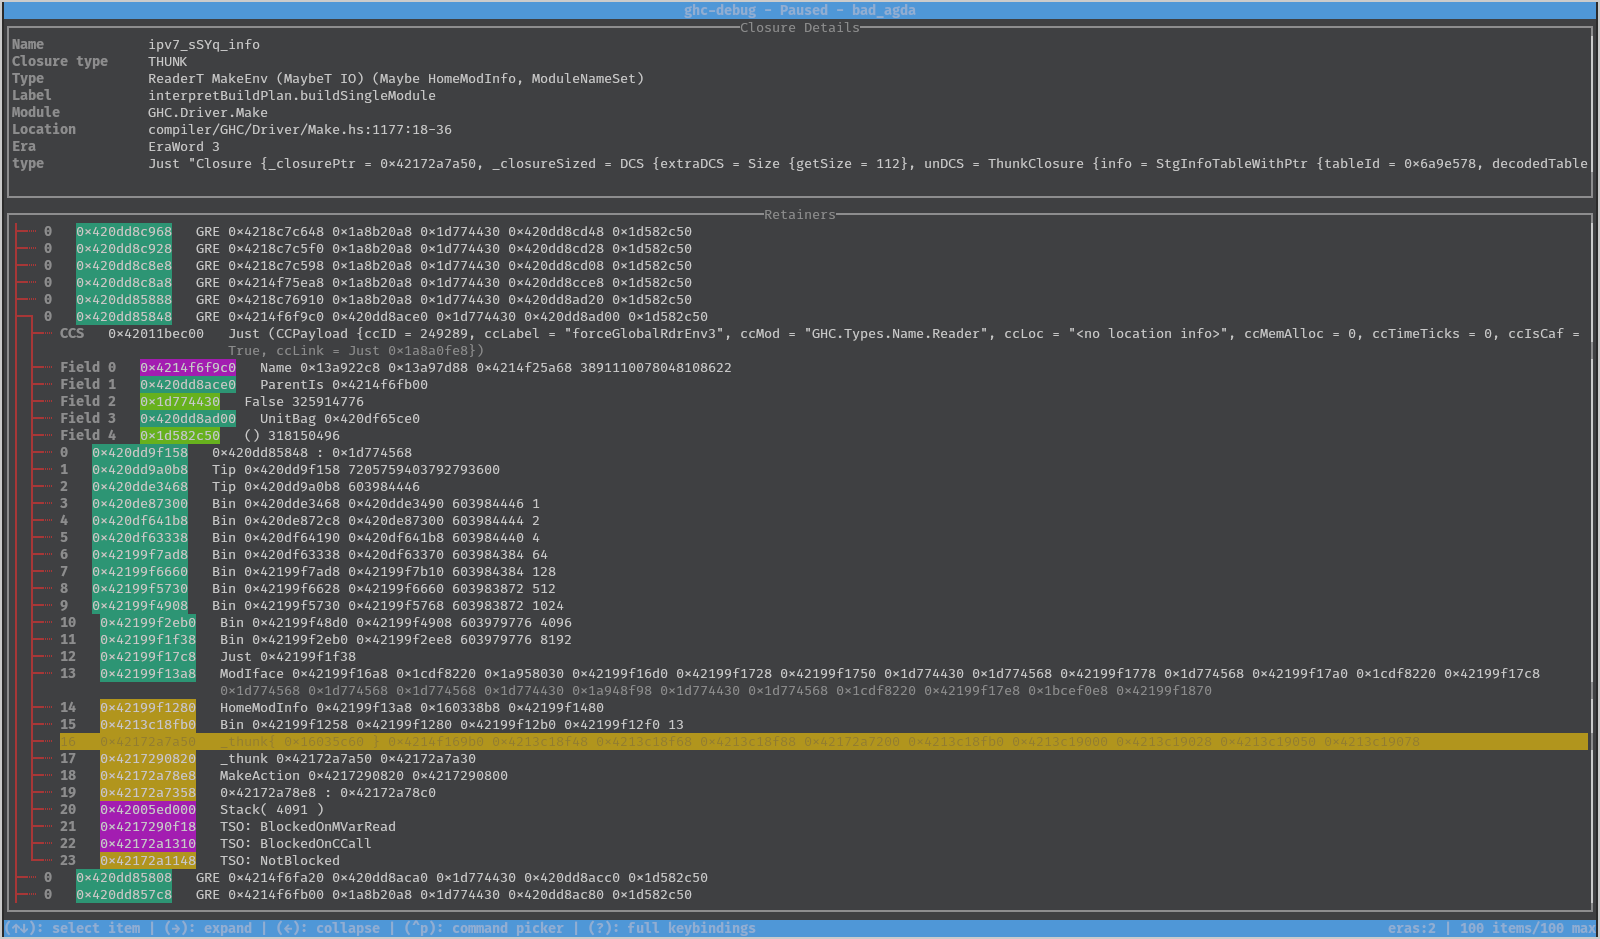
The location of the thunk tells us the exact location of the leak, and it is now just of matter of understanding why this code is retaining on to the unwanted objects and plugging the leak. For more details on the actual fix, see !11608.
Conclusion
We hope the new ghc-debug features and the eras profiling mode will be useful
to others investigating the memory behaviour of their programs and easily
identifying leaking objects which should not be retained in memory.
This work has been performed in collaboration with Mercury. Mercury have a long-term commitment to the scalability and robustness of the Haskell ecosystem and are supporting the development of memory profiling tools to aid with these goals.
Well-Typed are always interested in projects and looking for funding to improve GHC and other Haskell tools. Please contact info@well-typed.com if we might be able to work with you!