
As part of their Haskell Ecosystem Support Package, QBayLogic asked us to investigate
a space leak in one of their Haskell applications, a simulation of a circuit using Clash.
The starting point was a link to a ticket in the bittide-hardware package with reproduction instructions.
This post explains the debugging process which led to the resolution of this ticket. At the start of the investigation the program used 2 GB memory, at the end, about 200 MB, an improvement of approximately 10x!
First impressions
I first looked at the ticket report to get an idea of the problem.
- The ticket contained a profile generated by
eventlog2htmlwhich showed a profile of a program which runs in two phases. During these two phases the memory increased before resetting to some baseline and then increasing again. - Reproduction instructions were provided in the subsequent comment, I could run
these easily to reproduce the issue. I altered the options to use the
-hTprofiling mode to generate a basic heap profile without needing to compile with profiling support. This is a useful technique to get an initial handle on the problem. - The instructions used
profiling-detail: all-functions, which will insert many cost centres into the program which will significantly affect the runtime characteristics of the resulting program. I replaced this withprofiling-detail: late.
Most importantly, the ticket lacked a precise description about what the issue was with the profile. It may have been that this was exactly the memory profile that the program should exhibit! When starting to think about memory issues, thinking about memory invariants is a very helpful technique. The first question I ask myself is:
What is the memory invariant that the program should uphold?
This situation was a useful test of this technique, since I had no domain knowledge of what the program did, what the test did or what function the library even aimed to perform. It certainly highlighted to me the importance of knowing your domain and knowing the invariants.
Memory invariants
A memory invariant is a property that your program’s heap should obey. Establishing a memory invariant makes it easier to verify and fix memory issues, since if you have a precise invariant, it is easy to check whether the invariant holds.
A memory invariant consists of two parts:
- A predicate on the heap
- The timeline over which the predicate should hold
For example, some predicates on the heap might be:
- “No constructors of type T are alive”
- “There is an upper bound of 20000 bytestrings”
- “There are exactly 5 live closures of type T”
- “No closures of type T are reachable from closures of type Q”
When paired with a timeline, a memory invariant is formed. Example timelines include:
- “Before the second phase of the program”
- “During the cleanup phase”
- “After initialisation”
- “Between runs 10 and 100”
- “At all points of the program’s execution”
Establishing a memory invariant requires domain knowledge about the program. Without first establishing an invariant (even informally in your head), you can’t begin to debug memory usage of a program. The main challenge for me when investigating this issue was coming up with a memory invariant.
Initial investigation
In order to get an idea of how to proceed, I generated a “Profile by Closure Type” using
the -hT runtime system option.
cabal run bittide-instances:unittests -- -p RegisterWb +RTS -hT -l -RTSThe result was a unittests.eventlog file which contains the profiling
information.
I rendered this eventlog using eventlog2html and inspected the result in my
browser.
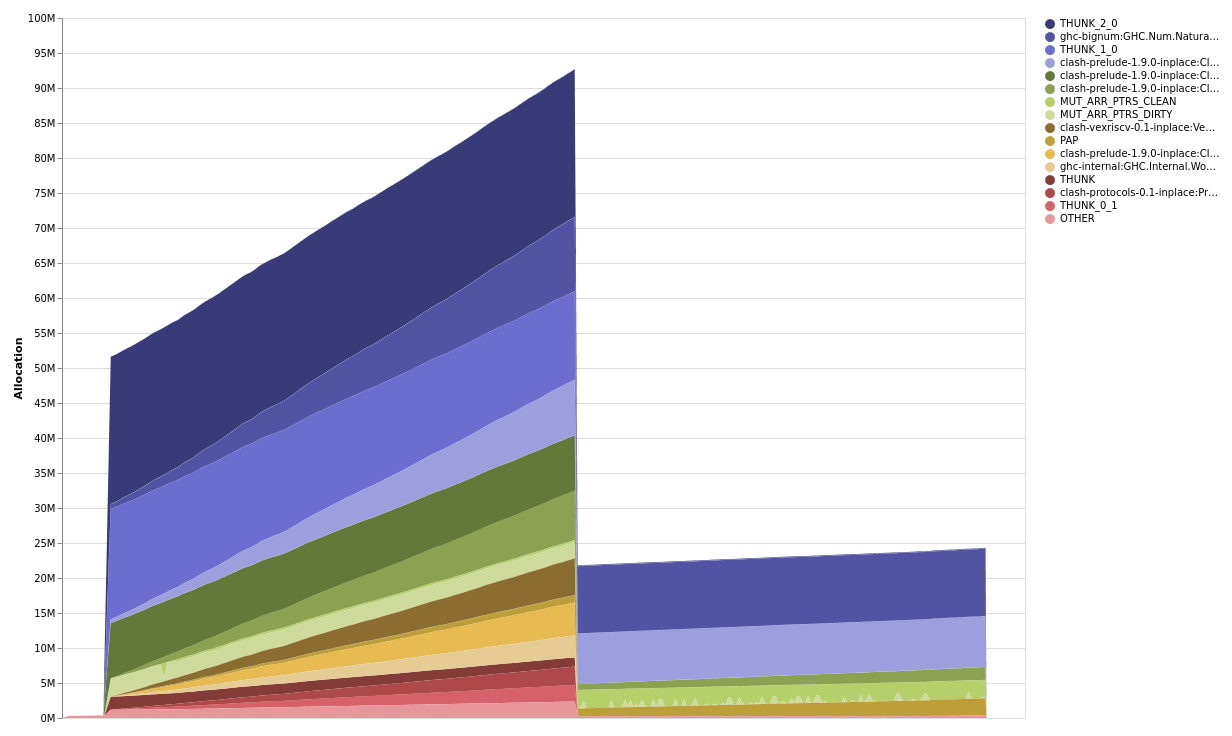
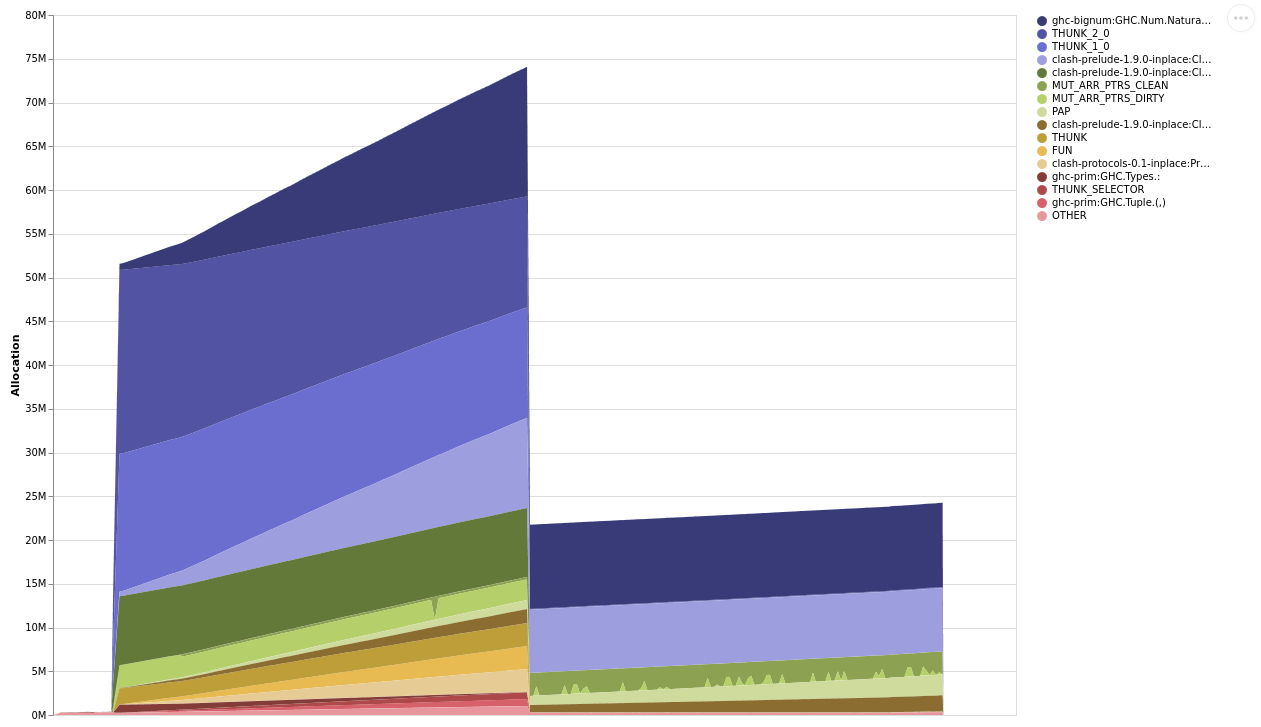
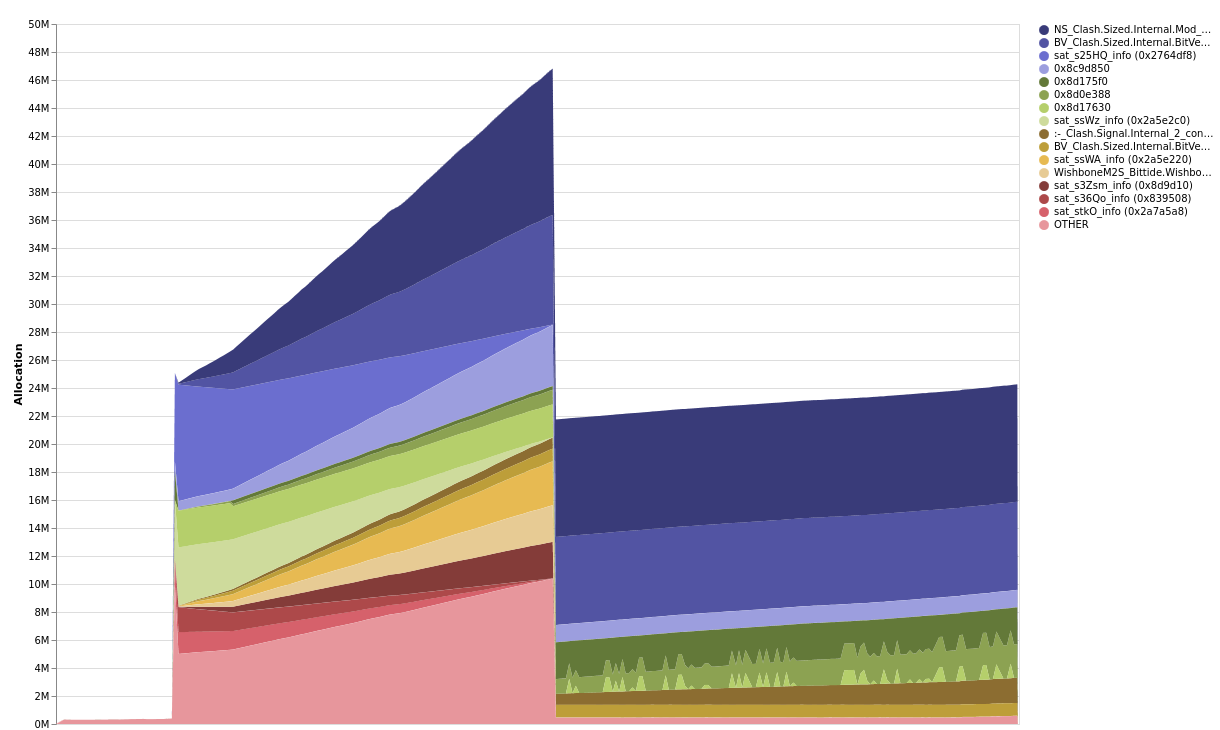
eventlog2html unittests.eventlogThe profile shows a coarse breakdown by the type of closures currently alive on the heap. The maximum value reported in the profile is about 600 MB. This value relates to the total memory used by the process (2 GB), but doesn’t include additional memory used by the RTS. The relationship between live bytes and OS memory usage is explained fully in this blog post. Reducing live memory is a good way to reduce the overall memory usage of your program, but it isn’t the only factor.
The top four bands came from
Clash.Signal.Internal.:-Protocols.Wishbone.Wishbone.S2MTHUNK_1_0- 2-tuples
(,)
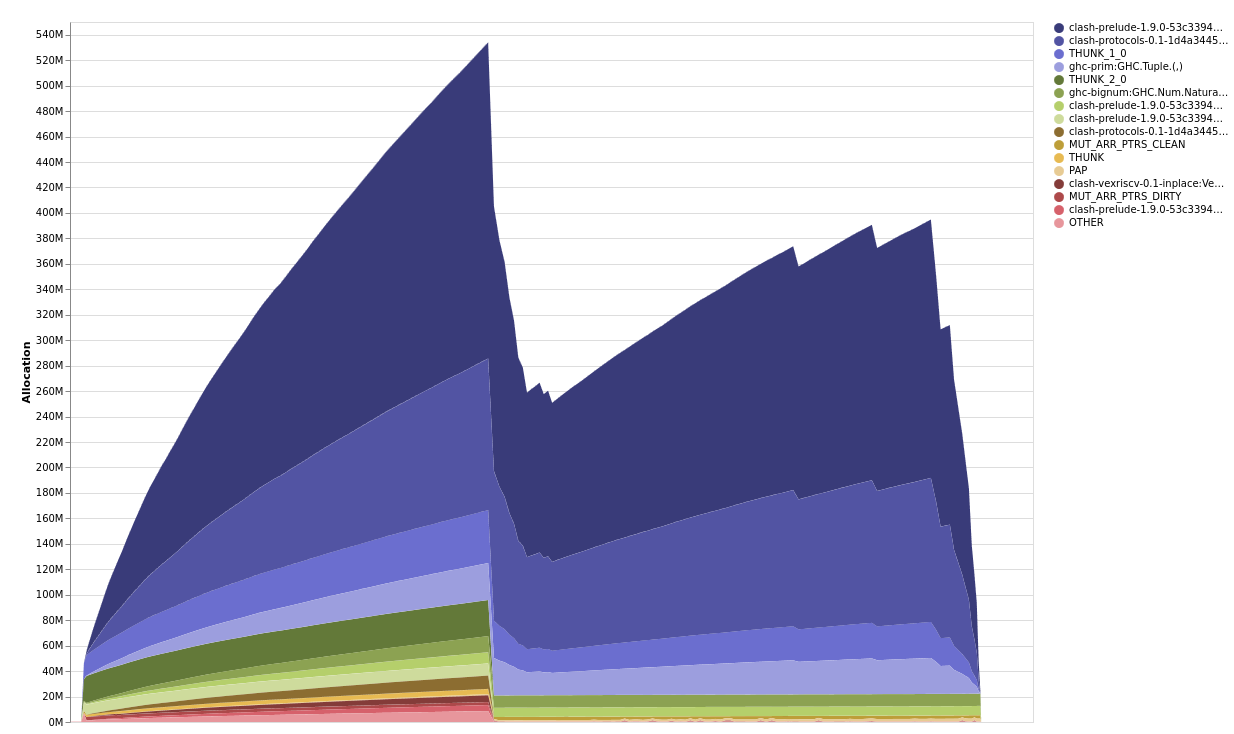
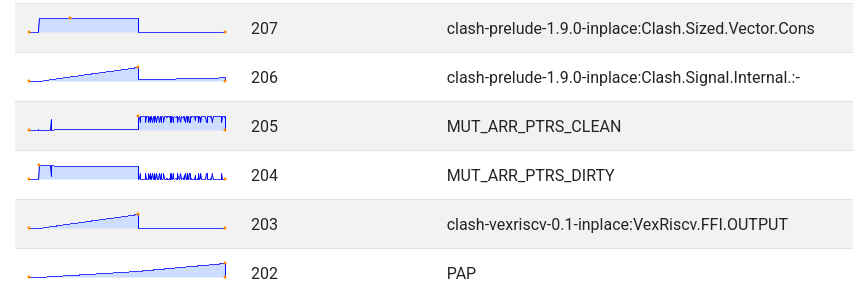
and as can be easily seen from the “detailed pane”, the patterns of allocation of these top four bands closely align with each other:
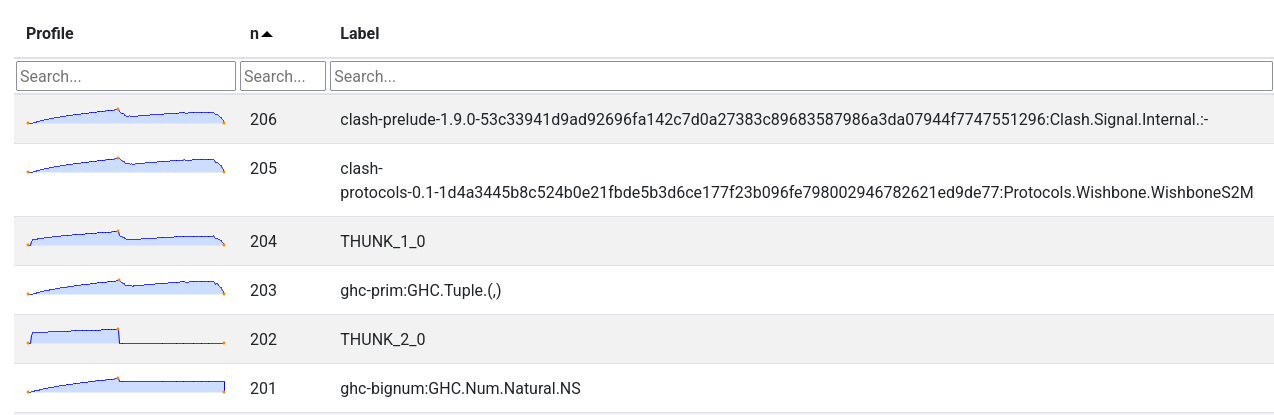
Looking at these correlations in the detailed pane can be invaluable in understanding the root issue, since memory issues are normally about different closures retaining each other, they are allocated together and retained together. Seeing these overall patterns can give you context about what exact kind of thing is using the memory.
Without a clear memory invariant, I wanted to get a better idea about
these top 4 bands of allocation, I had a hypothesis at this stage that the
THUNK closures were contained within tuples, which were retaining the WishboneS2M and :-
constructors.
A more specific profile with info table provenance
I want to know information about the precise source location of the :-, WishboneS2M constructors
and thunks. Therefore I enabled a few more debugging options to add this information
to the binary:
-finfo-table-map: Gives a source location to each thunk and data constructor-fdistinct-constructor-tables: Distinguishes between allocation sites of each constructor
Then if you make a profile using the -hi option, you get a very fine-grained breakdown about
where exactly in your program to start looking. That’s useful for me since I didn’t
yet look at any of the source code!
cabal run bittide-instances:unittests -- -p RegisterWb +RTS -hi -l -RTS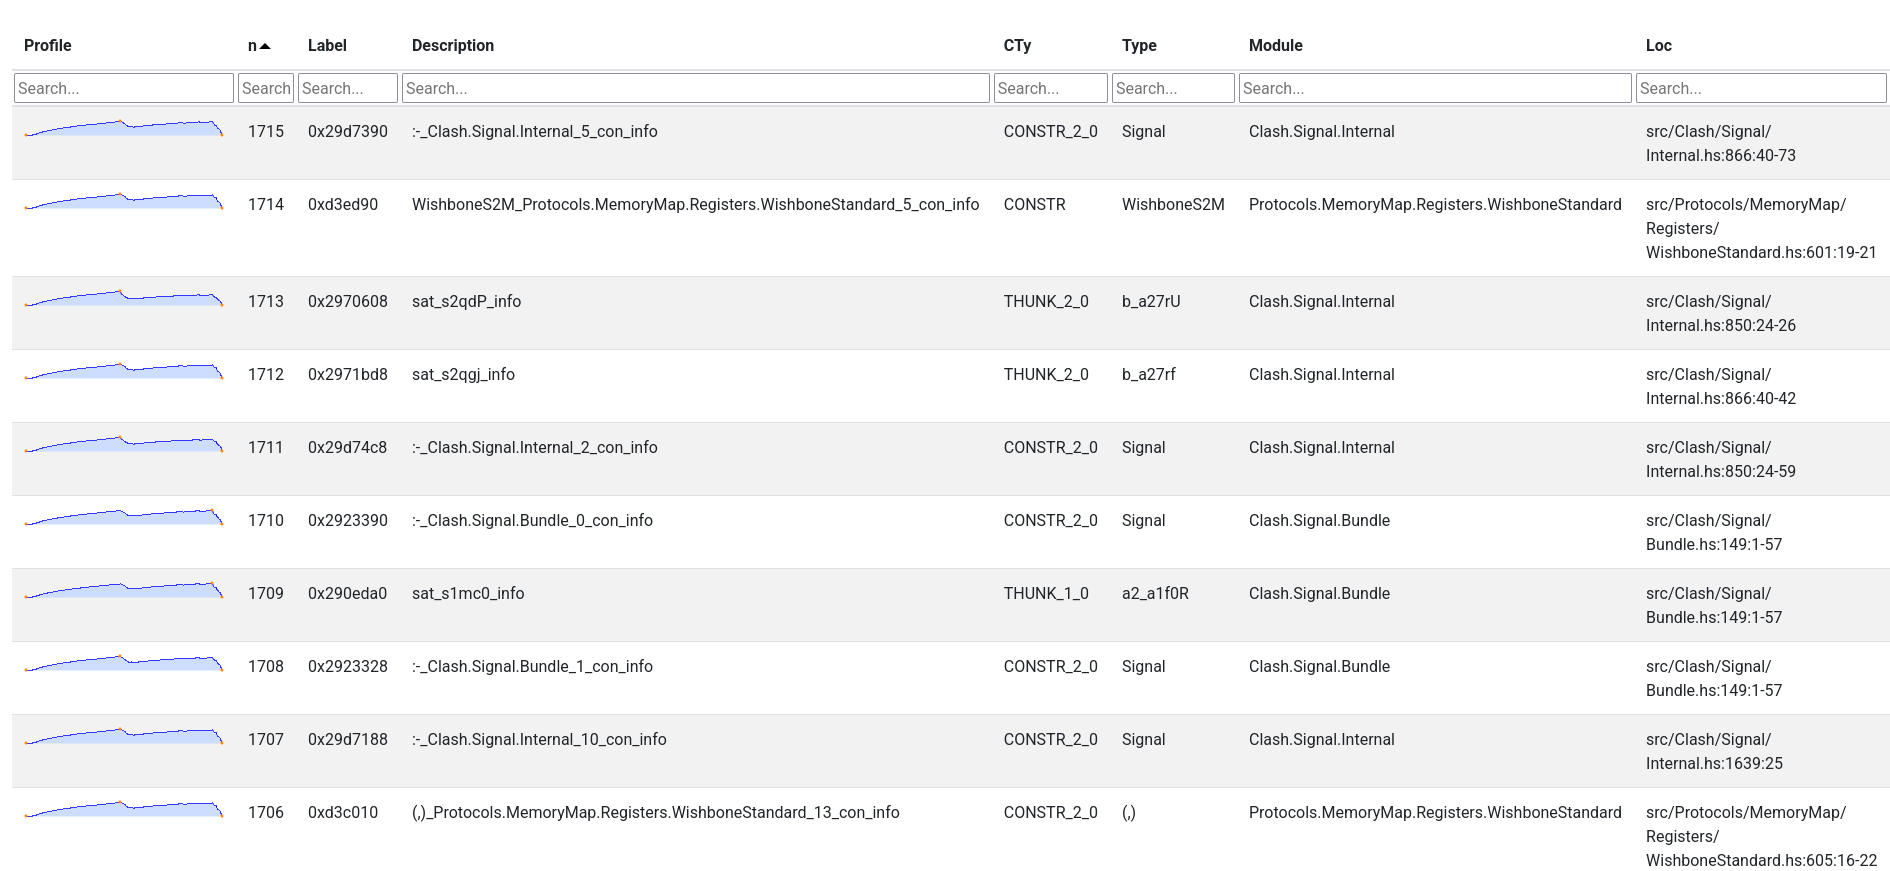
After consulting the source code in the relevant places, I quickly realised
that this wouldn’t necessarily be as straightforward an investigation as I had hoped.
I had hoped that the THUNK_1_0 locations reported in the -hT profile would
be clear that my hypothesis about retaining was correct, but the -hi profile didn’t
show up anything directly wrong. These locations were normal ways you could construct
a Clash circuit.
At this stage my lack of a memory invariant or some domain knowledge was a hindrance. I took the opportunity to consult Ben who knew about the Clash ecosystem and asked on the ticket what the expected profile should look like.
- The program is simulating a digital circuit.
- The
:-constructor represents a single time-step of simulation. - The expected memory profile is to use a constant (or near constant) amount of memory, since the circuit being simulated has bounded size.
For this program, a plausible invariant might have been: the number of :-
constructors should remain roughly constant during simulation.
With this knowledge, the number of :- constructors alive seemed to be the biggest
unexpected source of memory usage. Knowing that :- is a data constructor with two
arguments,
Each allocation is 24 bytes, so 240 MB of live :- closures corresponds to
roughly 10 million constructors. That is certainly an issue.
Secondly, the number of live WishboneS2M constructors looked wrong. I didn’t have
a good idea of the domain still, but by similar arithmetic, many millions of these
are also resident on the heap.
These two facts gave me some further avenues to investigate but I was going to
need to use ghc-debug to investigate further.
Using ghc-debug to investigate retainers
Using ghc-debug I wanted to establish
- What was retaining
:-constructors - What was retaining
WishboneS2Mconstructors
Therefore I instrumented the test executable, and launched ghc-debug-brick
in order to query what was retaining :- and WishboneS2M.
This was the start of making progress on the investigation.
To find the retainers of :-, I paused the test program just after the test started and used the “Find retainers”
command in ghc-debug-brick. The result was a list of 100 :- closures, and when expanded,
each one shows the path which was taken to reach it. It wasn’t very important where I paused,
as long as it was in this initial period, since we saw in the profile that the :- closures are alive and
linearly increasing for the whole phase.
When looking at retainers of :-, it was immediately noticeable that
the program contained very long chains of :- constructors (upwards of 5000 long).
This looked wrong to me, since my understanding was that :- was being used as a control
operation to drive the simulation of the circuit.
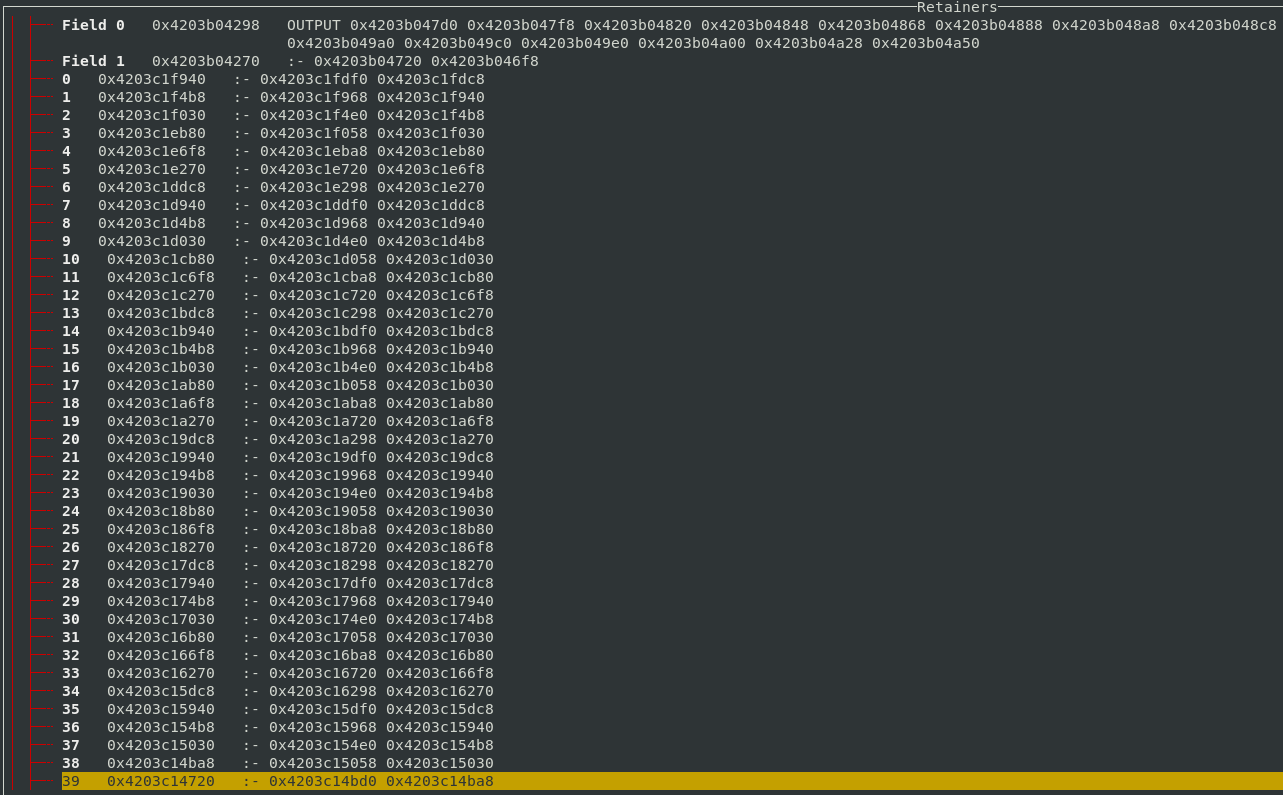
The information about where each :- constructor was allocated is not very informative.
That just gives me a location inside the library functions.
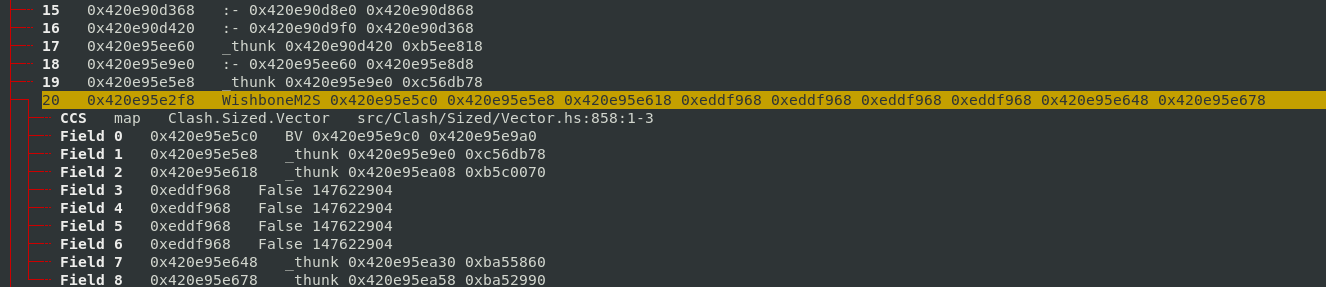
The question then becomes, why is :- being retained? I scrolled, for a long while,
and eventually get to the point where the chain of :- constructors is retained by
a non-:- constructor. That’s the interesting part since it’s the part of the program
which led to the long chain being retained.
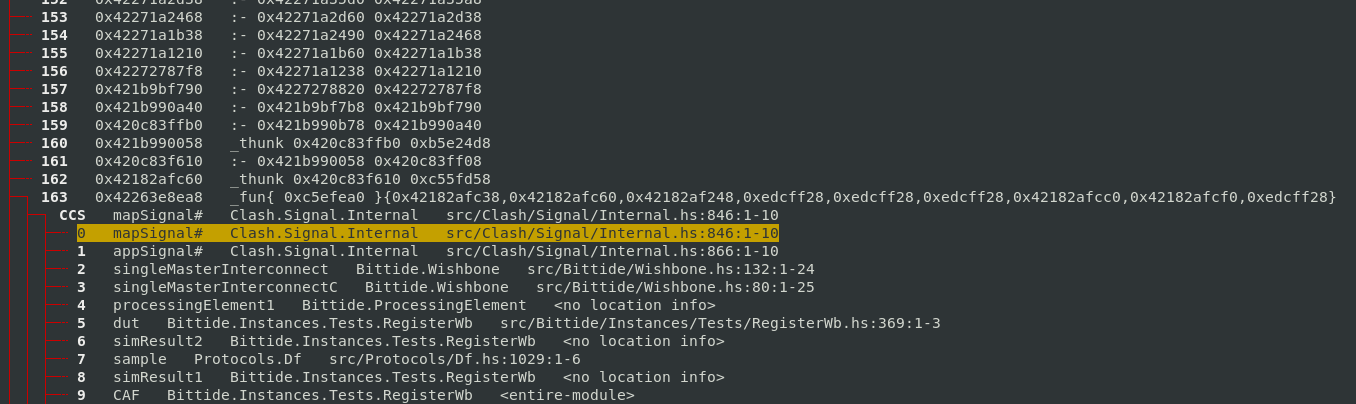
At the time, I didn’t think this looked so interesting, but also I didn’t know what I was looking for exactly.
So I kept going down the stack, looking for anything
which looked suspicious. In the end, I got quite lucky: I found a tuple which was
retained by a thunk. Since I had compiled with profiling enabled, I could see the cost
centre stack where the thunk was allocated, which pointed to the implementation of singleMasterInterconnectC.
Culprit 1: lazy unzip
In the source code of singleMasterInterconnectC, I worked out this part of the allocation was coming from
these calls to unzip.
go (((), m2s), unzip -> (prefixes, unzip -> (slaveMms, s2ms))) = ((SimOnly memMap, s2m), (\x -> ((), ((), x))) <$> m2ss)Then I looked at the definition of unzip, and found it was defined in a very lazy manner.
unzip :: Vec n (a,b) -> (Vec n a, Vec n b)
unzip xs = (map fst xs, map snd xs)
With this definition, the thunk created by applying map to fst and xs retains
a reference to xs, which retains a reference to all the bs as well as the as.
In a definition which performs a single iteration, if you force either list, both
will be evaluated and leave no reference to the other half.
I changed this definition to one which performed a single
iteration and this had a massive positive effect on memory usage.
unzip xs
  | clashSimulation = unzipSim xs
  | otherwise = (map fst xs, map snd xs)
 where
  unzipSim :: Vec m (a,b) -> (Vec m a, Vec m b)
  unzipSim Nil = (Nil, Nil)
  unzipSim (~(a,b) `Cons` rest) =
    let (as, bs) = unzipSim rest
    in (a `Cons` as, b `Cons` bs)
This issue was hard to spot with the tools, I got lucky, but it was harder to spot since
unzip was also marked as INLINE. In the end, I guessed right, but it’s a bit unsatisfying to
not have a great story about how I worked it out, but I knew the answer was somewhere
in the retainer stack I was looking at, and eventually I looked in the right place.
This problem is similar to one you can encounter when
using conduit and similar libraries.
In short, by sharing a thunk between two consumers, the input
structure can be retained longer than intended. Since one part of the program continues by
evaluating the thunk, the other reference
is updated to the result of the thunk being evaluated. This is a problem though,
since the original structure was intended to be used for control and discarded
immediately after driving the next step of execution.
Culprit 2: lazy record update retains old field values
Once the original problem had been fixed,
memory usage was much improved. I circled back to the start to look at a modified -hT profile.
Perhaps there were still other problems lurking?
The final phase of memory usage looks much better, so I turned my attention to the initial phase.
In the initial phase, it looked like OUTPUT was increasing linearly.
I turned to
ghc-debug again, inspected the retainers of the OUTPUT constructor and discovered that
the fields of WishboneM2S were not being strictly updated, indirectly keeping a reference to
the OUTPUT constructor.
I looked at the source location that WishboneM2S was allocated,
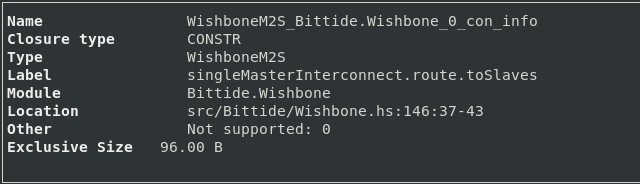
and made the update strict:
     toSlaves =
-      (\newStrobe -> (updateM2SAddr newAddr master){strobe = strobe && newStrobe})
+      (\newStrobe -> strictM2S $ (updateM2SAddr newAddr master){strobe = strobe && newStrobe})
         <$> oneHotOrZeroSelected
     toMaster
       | busCycle && strobe =
@@ -152,10 +152,8 @@ singleMasterInterconnect (fmap pack -> config) =
             (maskToMaybes slaves oneHotOrZeroSelected)
       | otherwise = emptyWishboneS2M

+    strictM2S (WishboneM2S !a !b !c !d !e !f !g !h !i) = WishboneM2S a b c d e f g h i
This resulted in another reduction in memory usage:
Culprit 3: lack of sharing in iterate
When I returned to the profile a final time, the memory usage seemed much better,
especially in the initial section. I had now eliminated retained :- constructors,
so the overall memory usage was much lower, but still increasing slightly. I turned
to a -hi profile again to get more information about the THUNK bands.
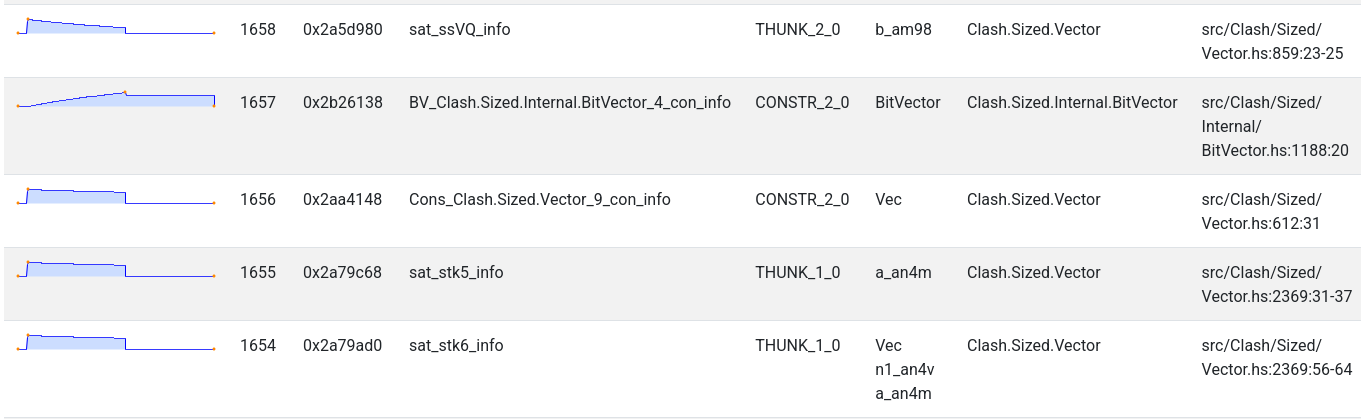
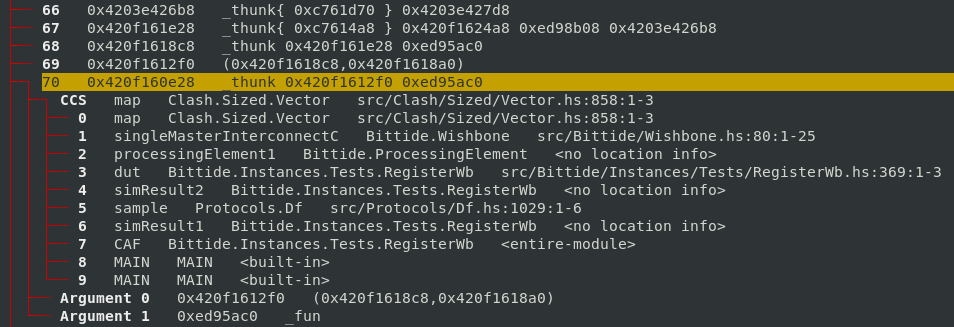
Looking at the source code for the sat_ssVQ thunks, they come from the Clash.Sized.Vector.map function. Therefore…
back to ghc-debug to see what retains these map thunks, and the callstack where
they are allocated from. This time I used “Find Retainers (Exact)”, to find closures
which are named sat_ssVQ_info.
The first one I looked at, I found was allocated from iterateI by inspecting the cost
centre stack.
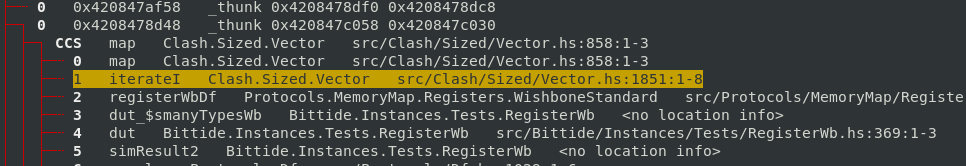
iterateI was implemented as follows:
iterateI :: forall n a. KnownNat n => (a -> a) -> a -> Vec n a
iterateI f a = xs
  where
    xs = init (a `Cons` ws)
    ws = map f (lazyV xs)
Reasoning about the definition, you can see that iterateI will result in a vector
of the form:
a `Cons` map f (a `Cons` (map f (a `Cons` ...)))As a result,
each element of the vector will independently compute f^n a, no intermediate results
will be shared, a quadratic amount of thunks for the n applications of f will
be allocated.
Defining iterateI in a directly recursive style means only a linear amount of
thunks will be allocated and f will be computed only a linear number of times.
iterateU :: UNat n -> (a -> a) -> a -> Vec n a
iterateU UZero _ _ = Nil
iterateU (USucc s) f a = a `Cons` iterateU s f (f a)
Even better, for the specific example, was to use a strict accumulator, so no intermediate thunks were allocated or retained in the early part of the program.
Final result
The final profile shows slightly higher memory usage in the initial phase of the program’s execution than the second phase, but looking at the detailed pane, I could identify why the memory was retained.
Overall, the total memory usage decreased from about 2 GB to 200 MB. There is probably still some improvement which can be made to this profile, but we felt like it was a good place to stop for this post.
Conclusion
The goal of this post is to document the thought process involved in investigating a memory issue. Overall, I feel like I would have found it easier to fix the problem with some domain knowledge. Once I acquired some knowledge about the domain I made much more rapid progress about what to investigate.
The main cause of the memory leak was not obvious, and I got a bit lucky in finding the right place. One issue being the problem was obfuscated by the problematic definition being inlined. In general, with a busy heap, finding the needle can be quite tricky. Debugging the subsequent issues was more straightforward.
In the future, we want to explore more reliable ways to identify and investigate
the kinds of memory invariants that were violated in this program. For example,
it was crucial to know that :- should not be retained, perhaps additional language
design can express that property more clearly. On another note, a logical specification
of memory invariants could be useful to automatically detect and pause the program at
the exact point a violation was detected.
There remains significant potential to improve our memory debugging tooling!
This work was performed for QBayLogic as part of their Haskell Ecosystem Support Package. If your company is using Haskell and from time to time requires expert help in issues like this, our packages fund maintenance on core tooling such as GHC and Cabal, as well as development or support for your specific issues. Please contact info@well-typed.com if we might be able to help you!